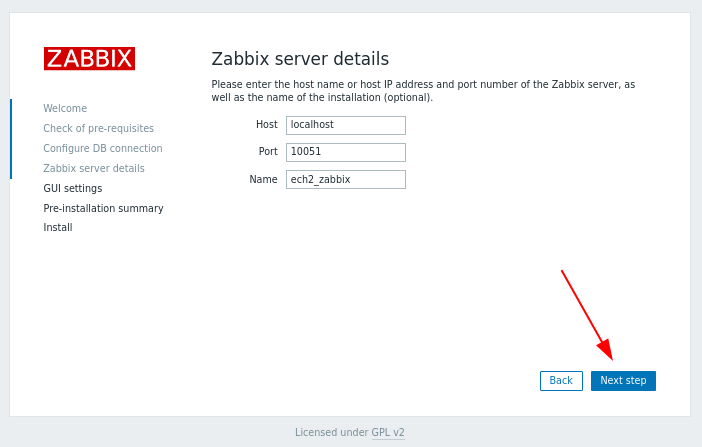
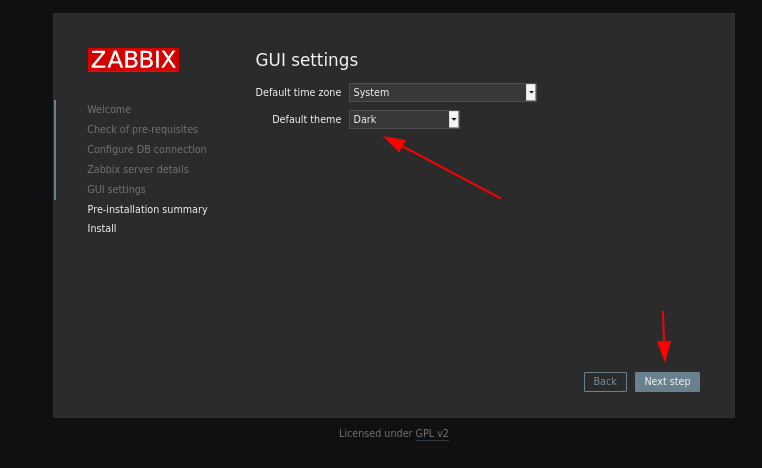
Web Interface Installation
coming soon
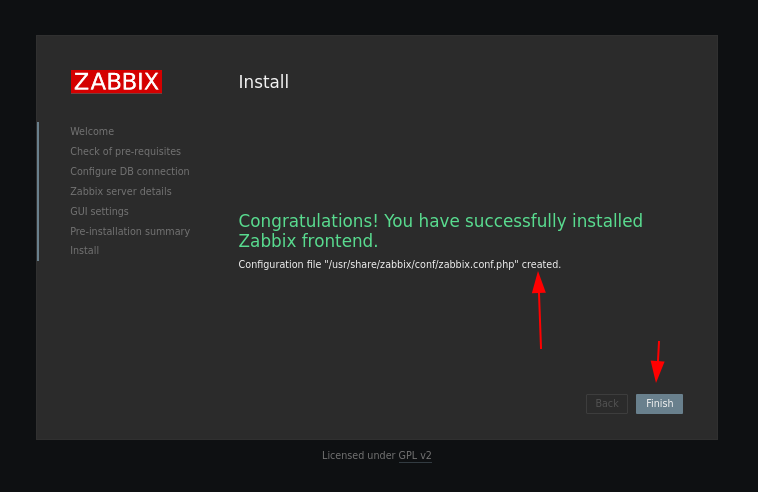
If it can't create the config file, it's fine just create it yourself:
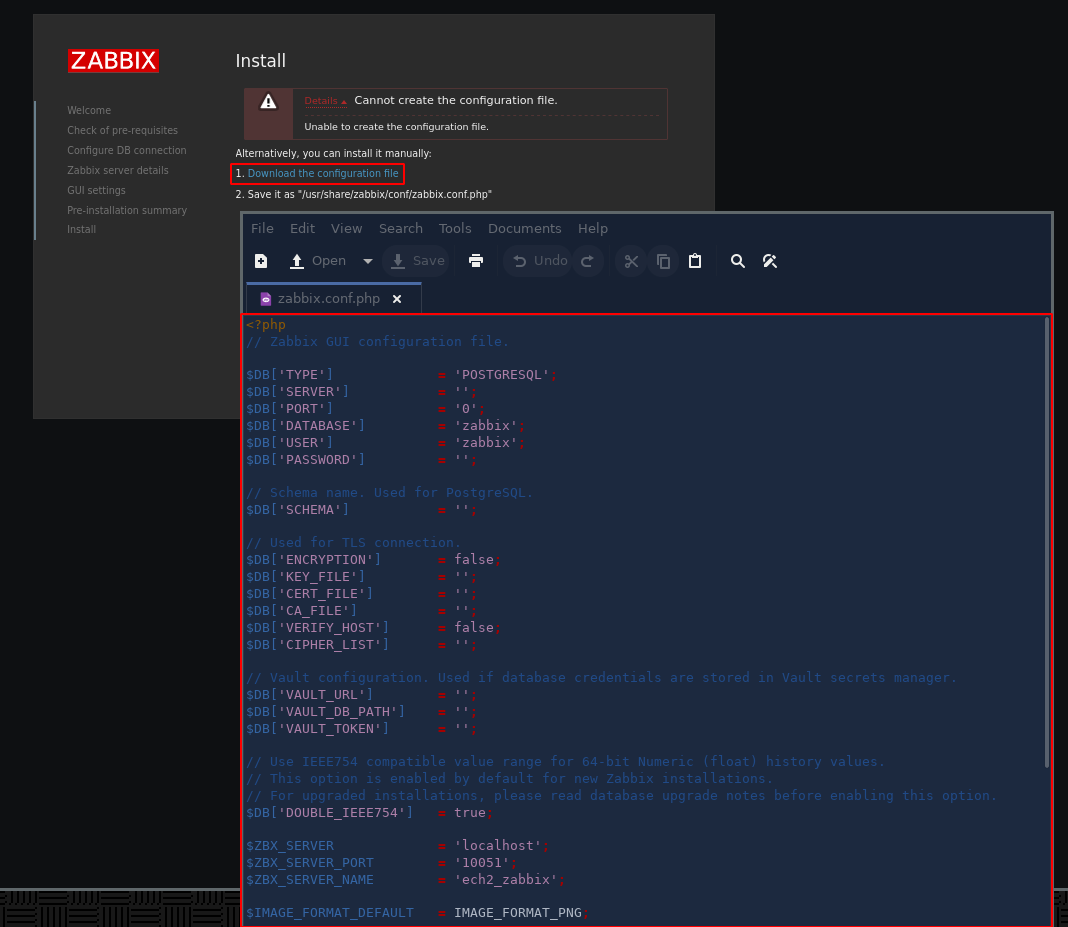
hit ctrl+A and ctrl+X to select all and copy the entire file, and then paste into nano :
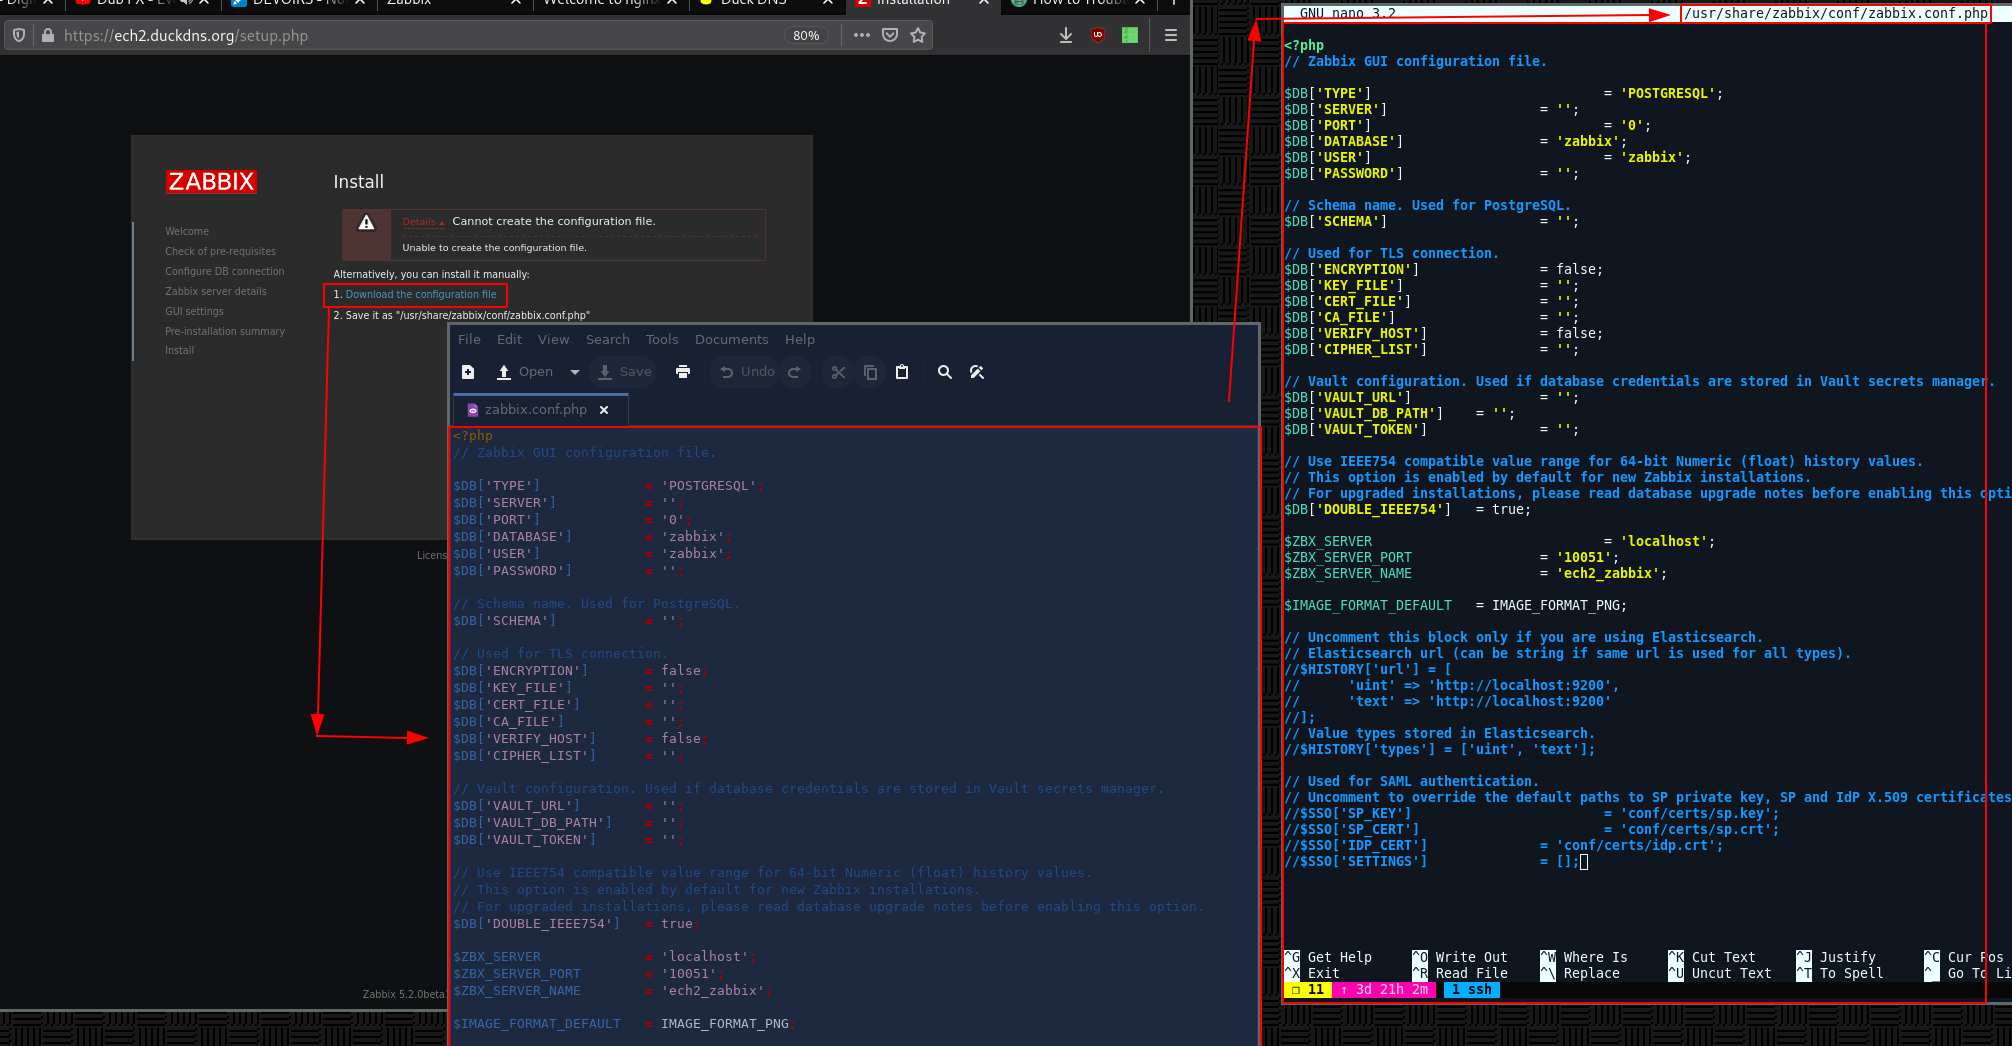
nano /usr/share/zabbix/conf/zabbix.conf.php
Once in nano, hit ctrl+shift+V to paste, and then ctrl+S to save, and ctrl+X to exit.
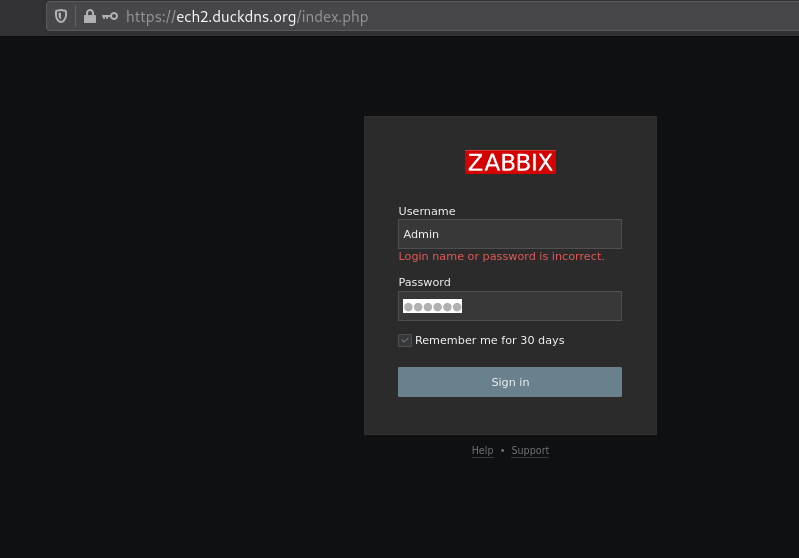
And once that's done, get to the login page:
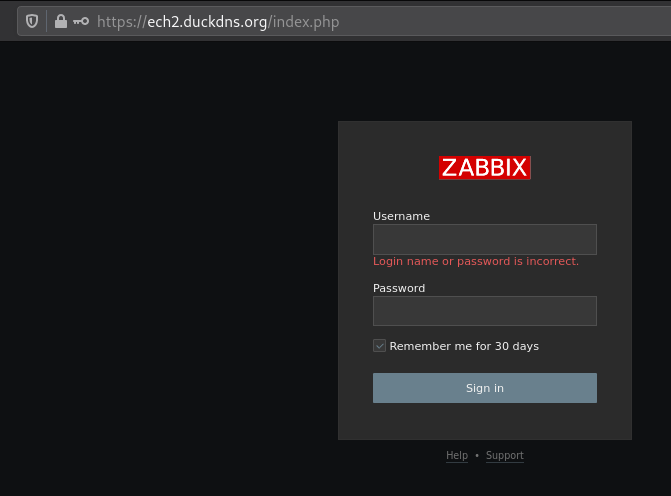
Here just input the Admin:zabbix credentials:
And that's it ! we have been able to install zabbix on a debian10 server using nginx, php7.3 and postgresql 12.
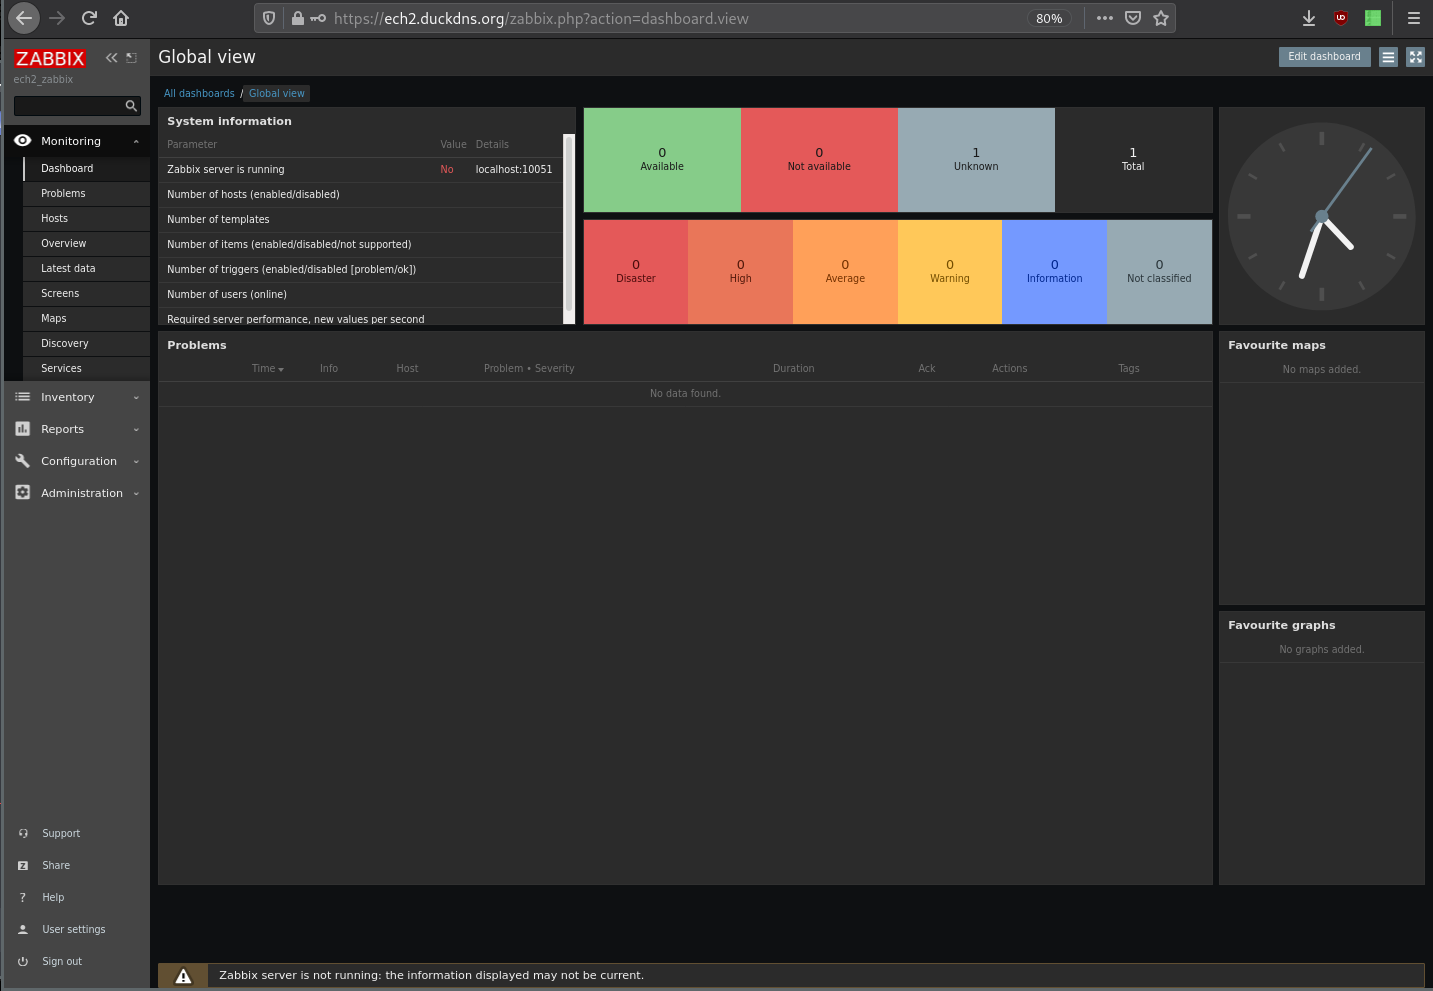
Now here you may get the 'Zabbix server is not running: the information displayed may not be current.' error message at the bottom, so let's fix this by editing the /etc/zabbix/zabbix_server.conf file:
root@Zabbix:~# tail -f /var/log/zabbix/zabbix_server.log
 20777:20210501:184150.043 database is down: reconnecting in 10 seconds
 20777:20210501:184200.060 [Z3001] connection to database 'zabbix' failed: [0] fe_sendauth: no password supplied

 20777:20210501:184200.061 database is down: reconnecting in 10 seconds
 20777:20210501:184210.079 [Z3001] connection to database 'zabbix' failed: [0] fe_sendauth: no password supplied

 20777:20210501:184210.079 database is down: reconnecting in 10 seconds
 20777:20210501:184220.096 [Z3001] connection to database 'zabbix' failed: [0] fe_sendauth: no password supplied

 20777:20210501:184220.096 database is down: reconnecting in 10 seconds

root@Zabbix:~# vim /etc/zabbix/zabbix_server.conf

[...]

DBPassword=zabbix

[...]

:wq

root@Zabbix:~# systemctl restart zabbix-server
And that's it! That's what you need to do if the zabbix-server is not running, you need to check what's happening from the error log /var/log/zabbix/zabbix_server.log, and then edit /etc/zabbix/zabbix_server.conf accordingly.
Now before moving forward let's make sure snmp is configured on our debian zabbix host:
root@Zabbix:~# apt install snmp snmpd php7.3-snmp -y
root@Zabbix:~# systemctl restart zabbix-server
Once that's done, you will be able to add hosts with snmp:
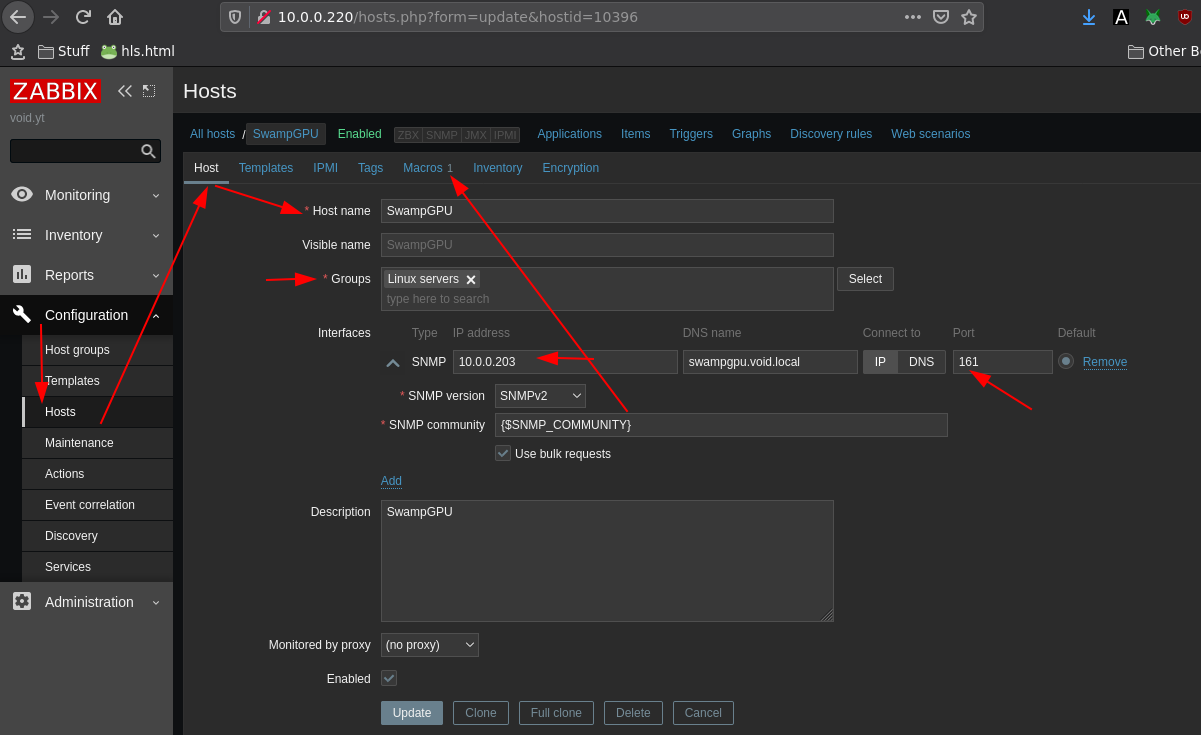
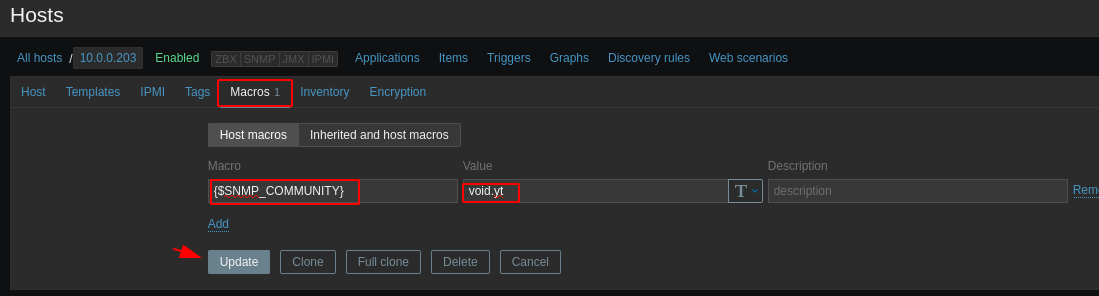
We're going to use a macro that will contain our 'secret' snmp community string, obviously if you are using a public host you want this snmp community string to be complex and hard to guess to be secure.
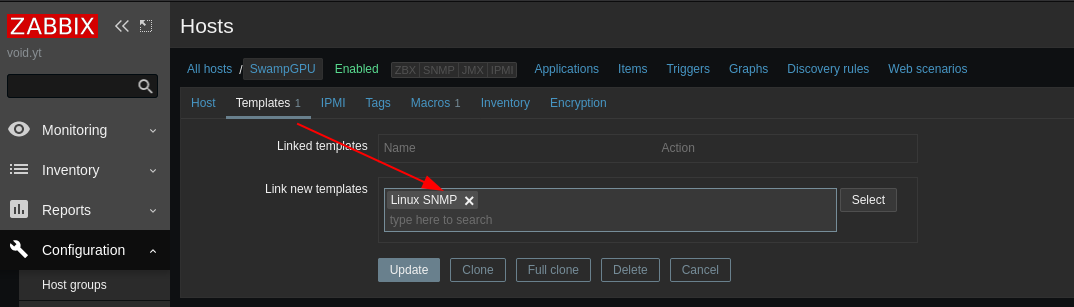
Save the new host and enable it:
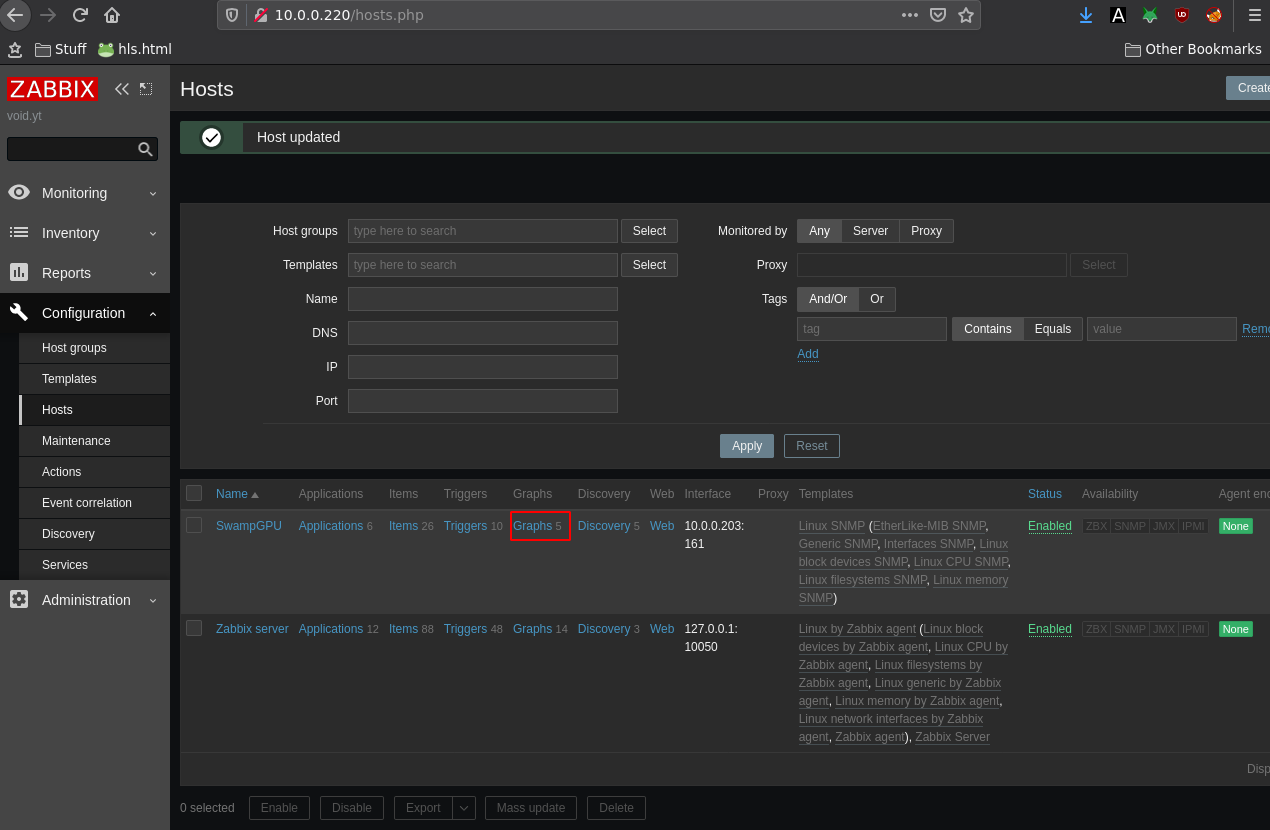
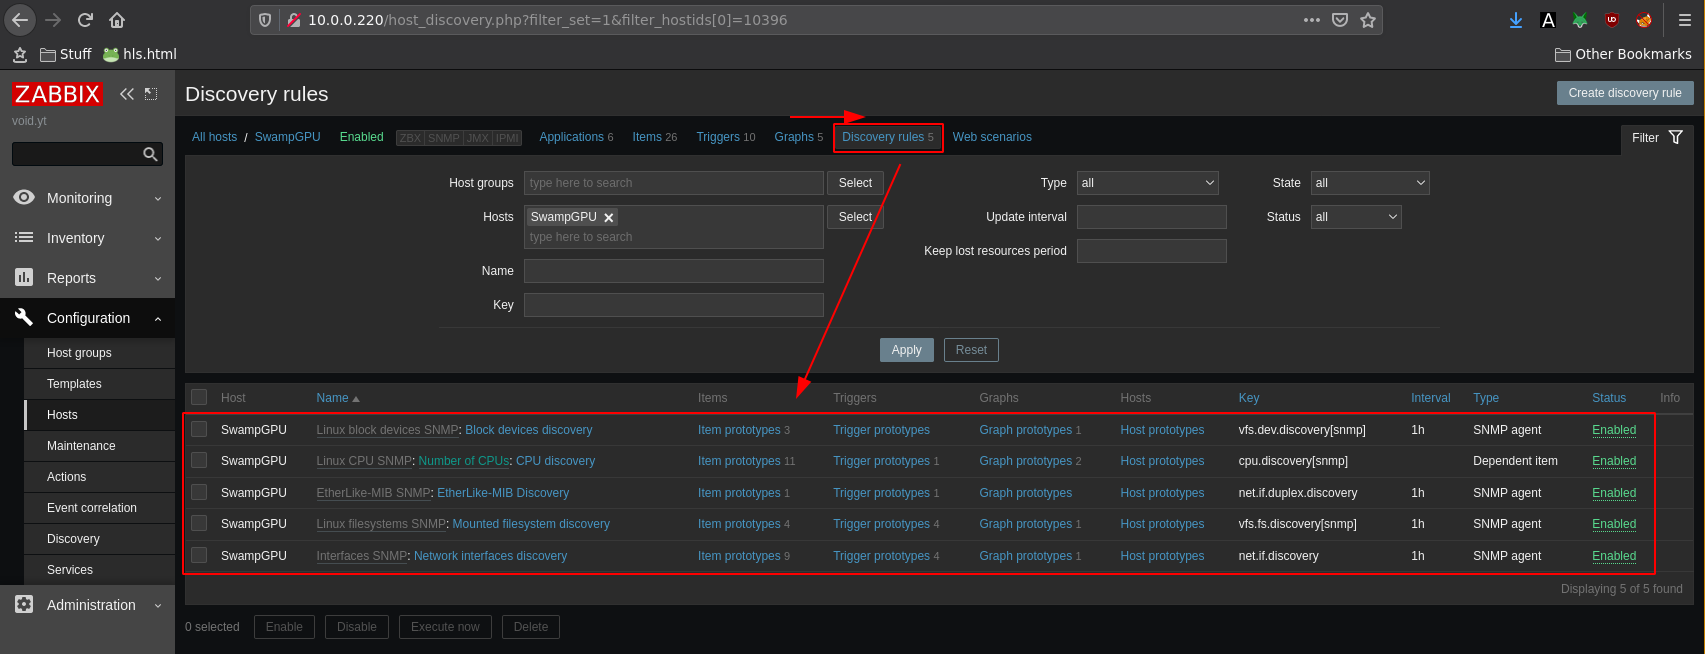
here you can see that the snmp queries are working, since we have access to graphs about our host:
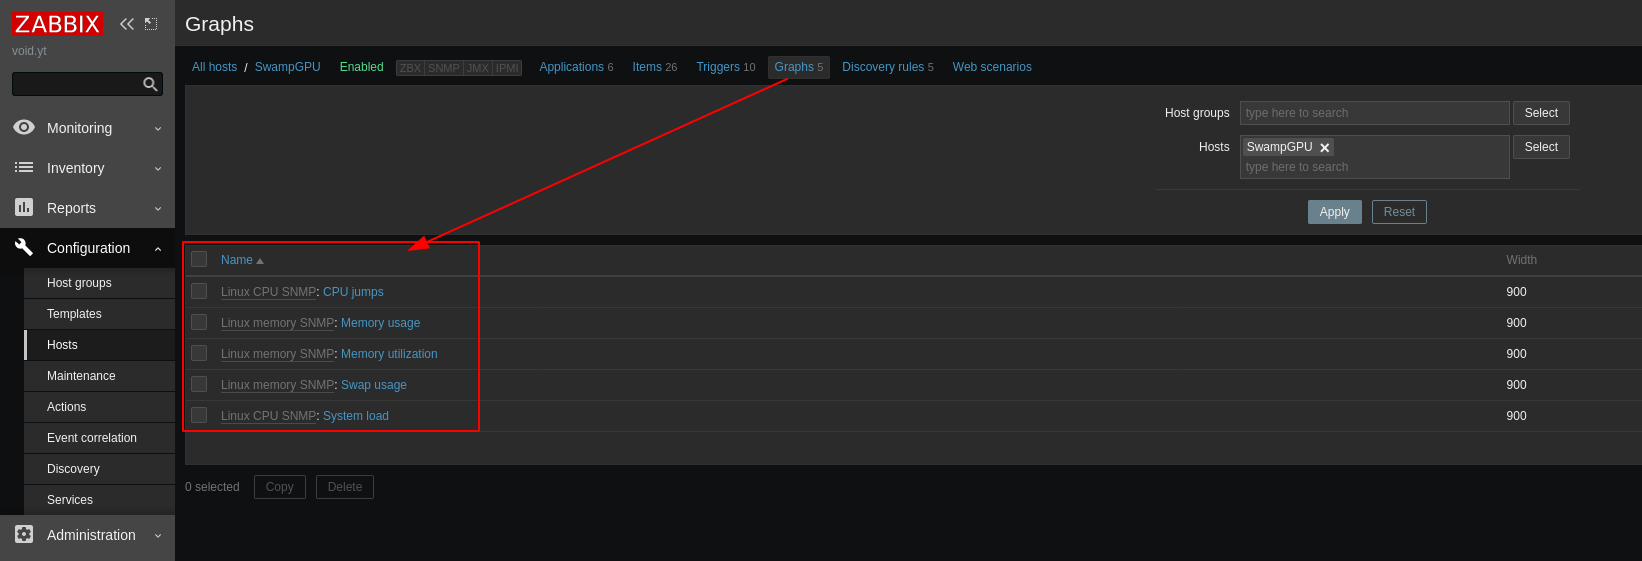
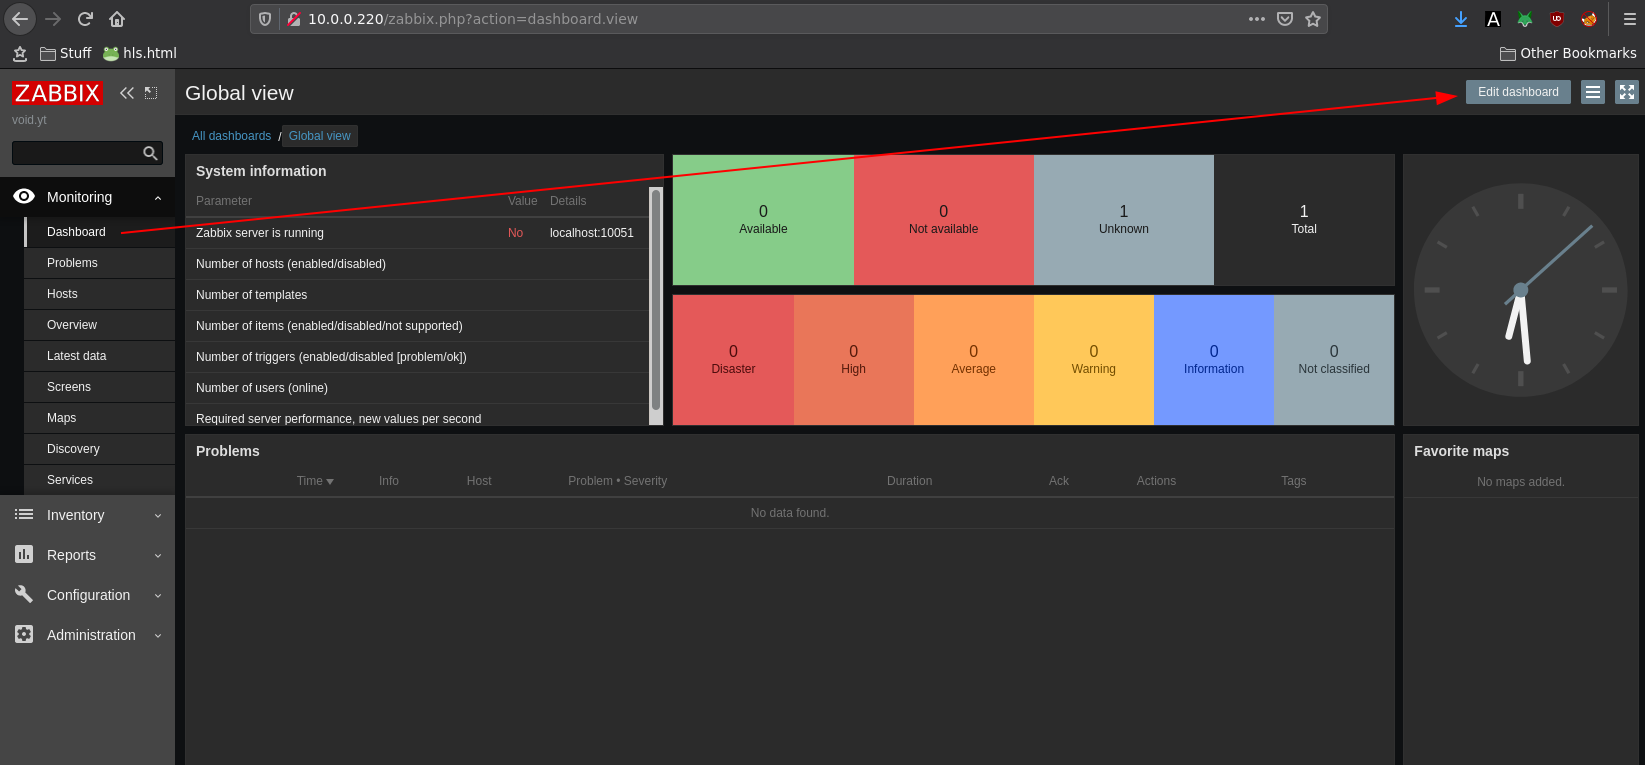
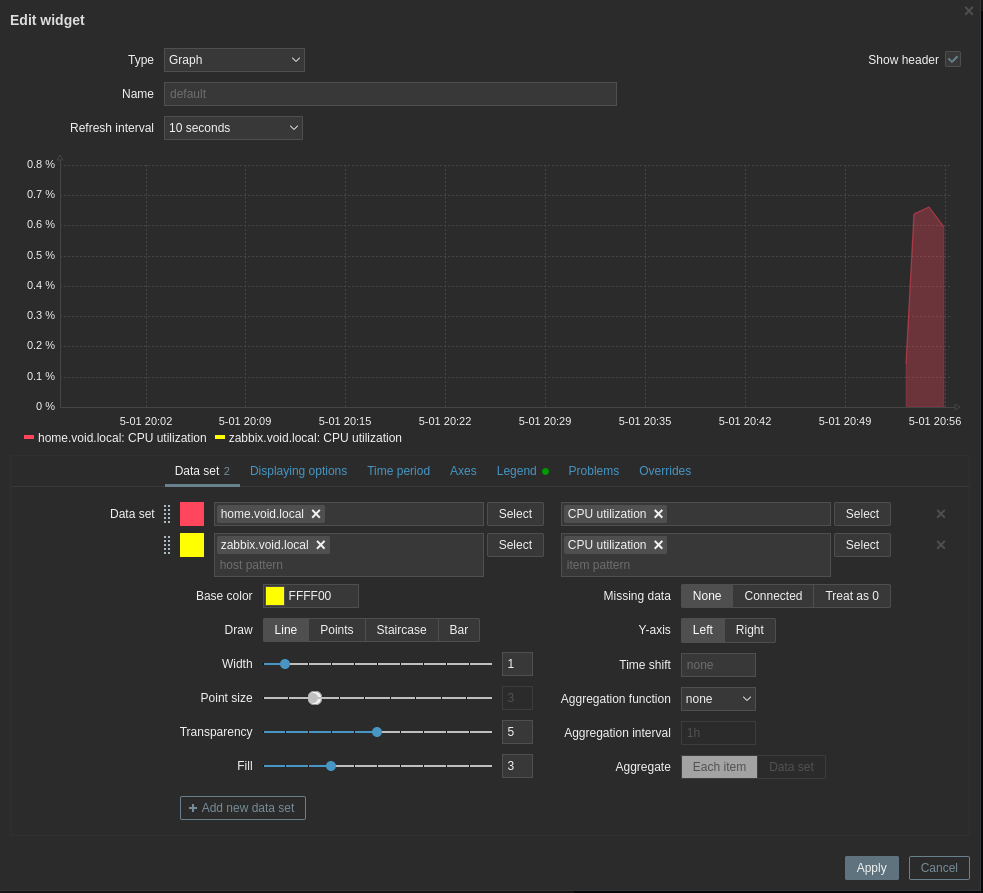
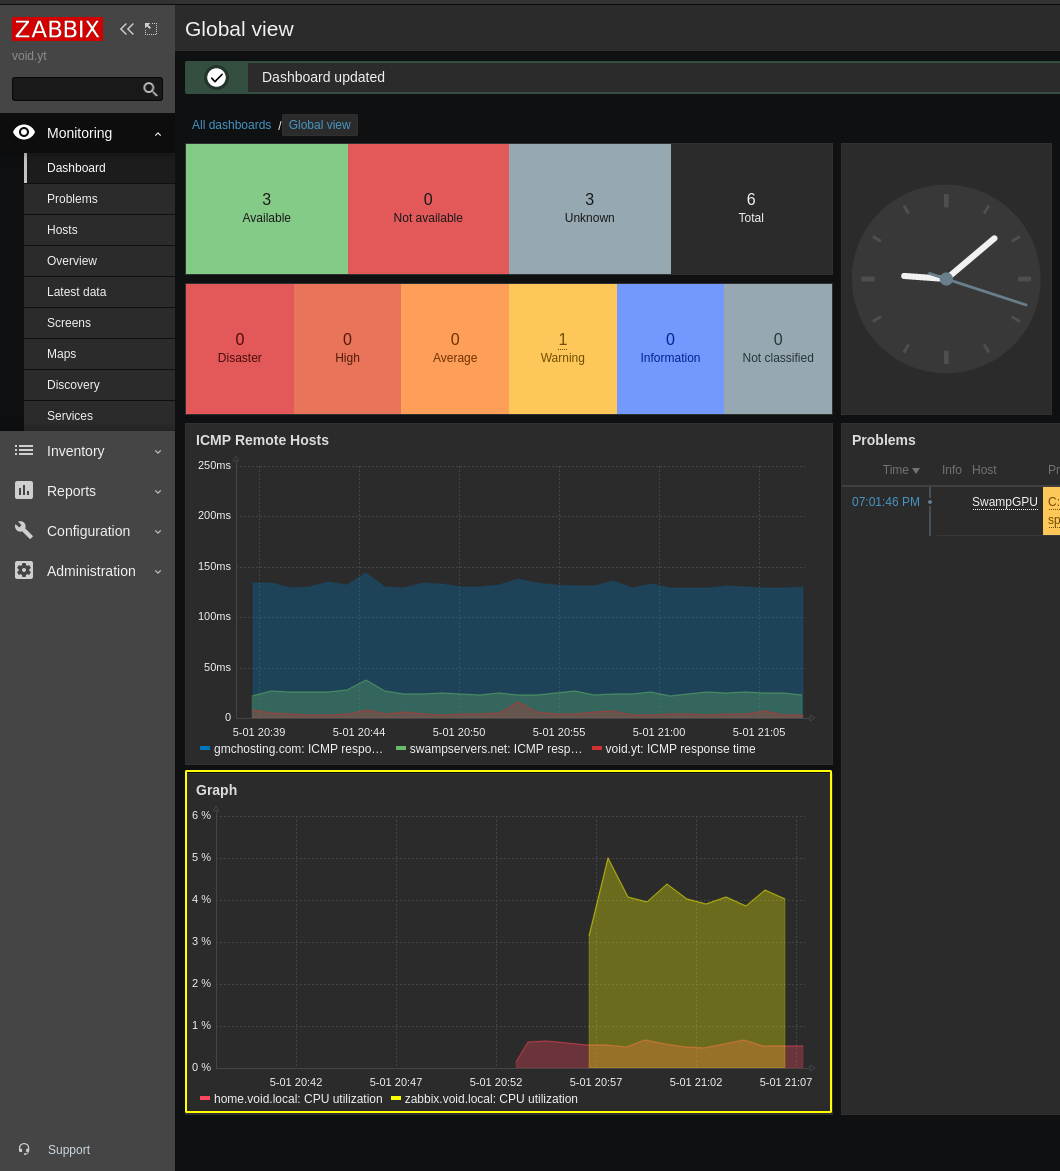
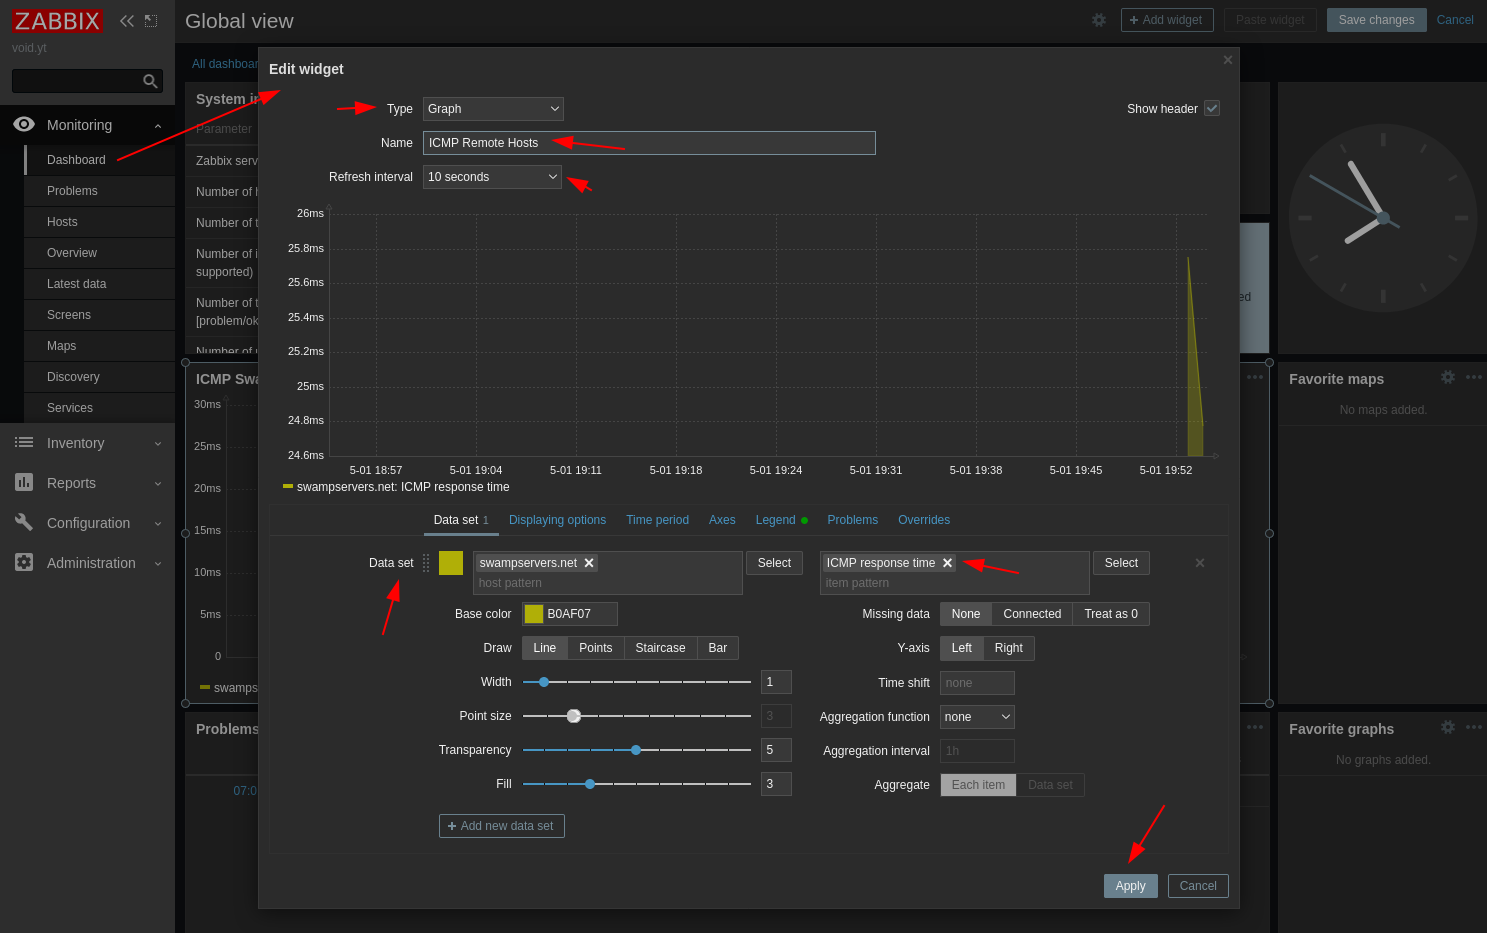
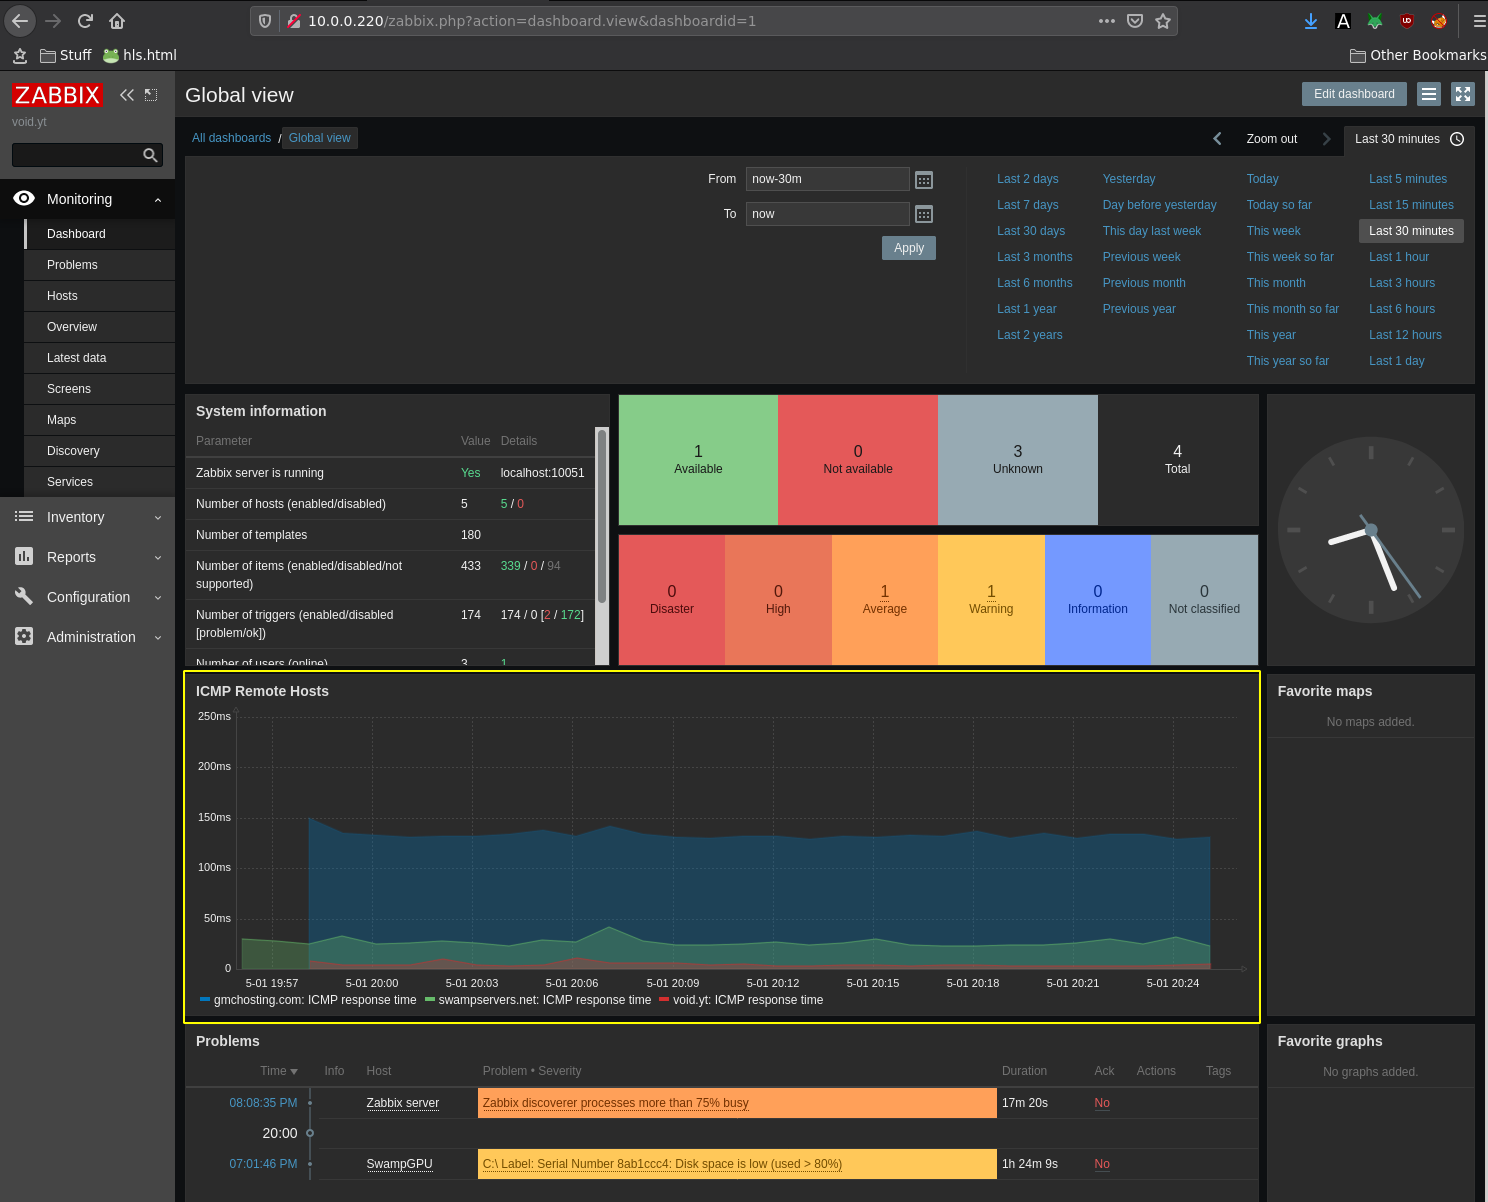
Now that we know it's working, we're going to edit the main zabbix dashboard, and we will add a Widget containing one of the graphs of our SNMP host:

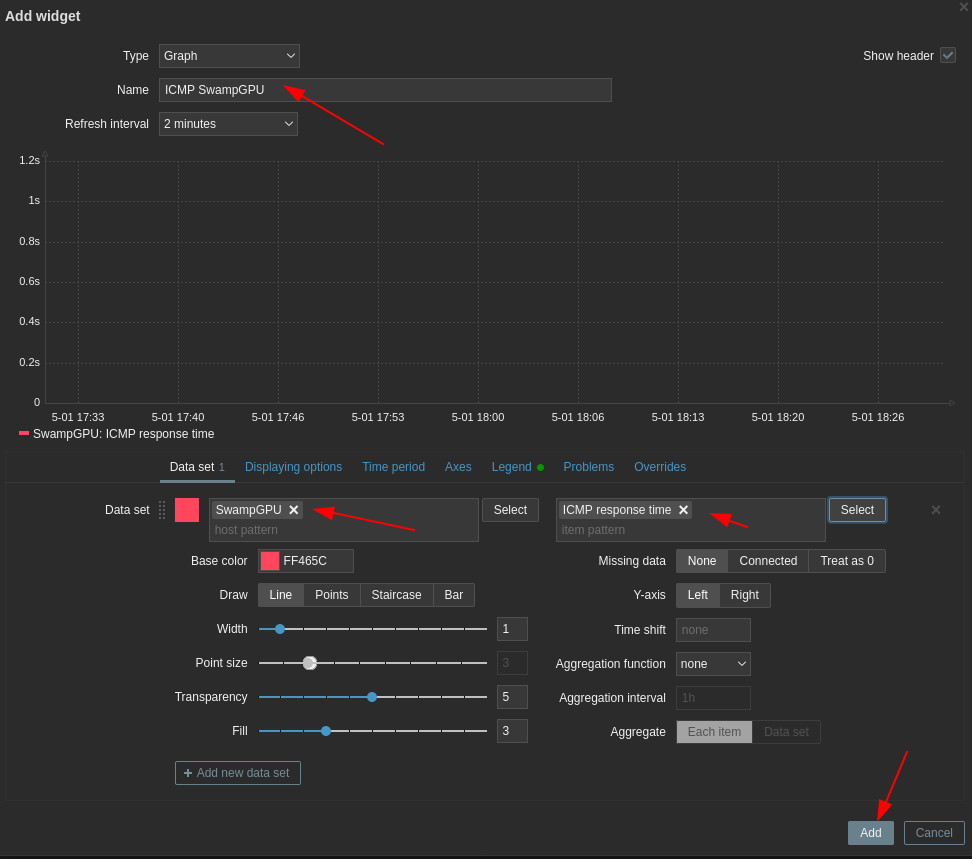
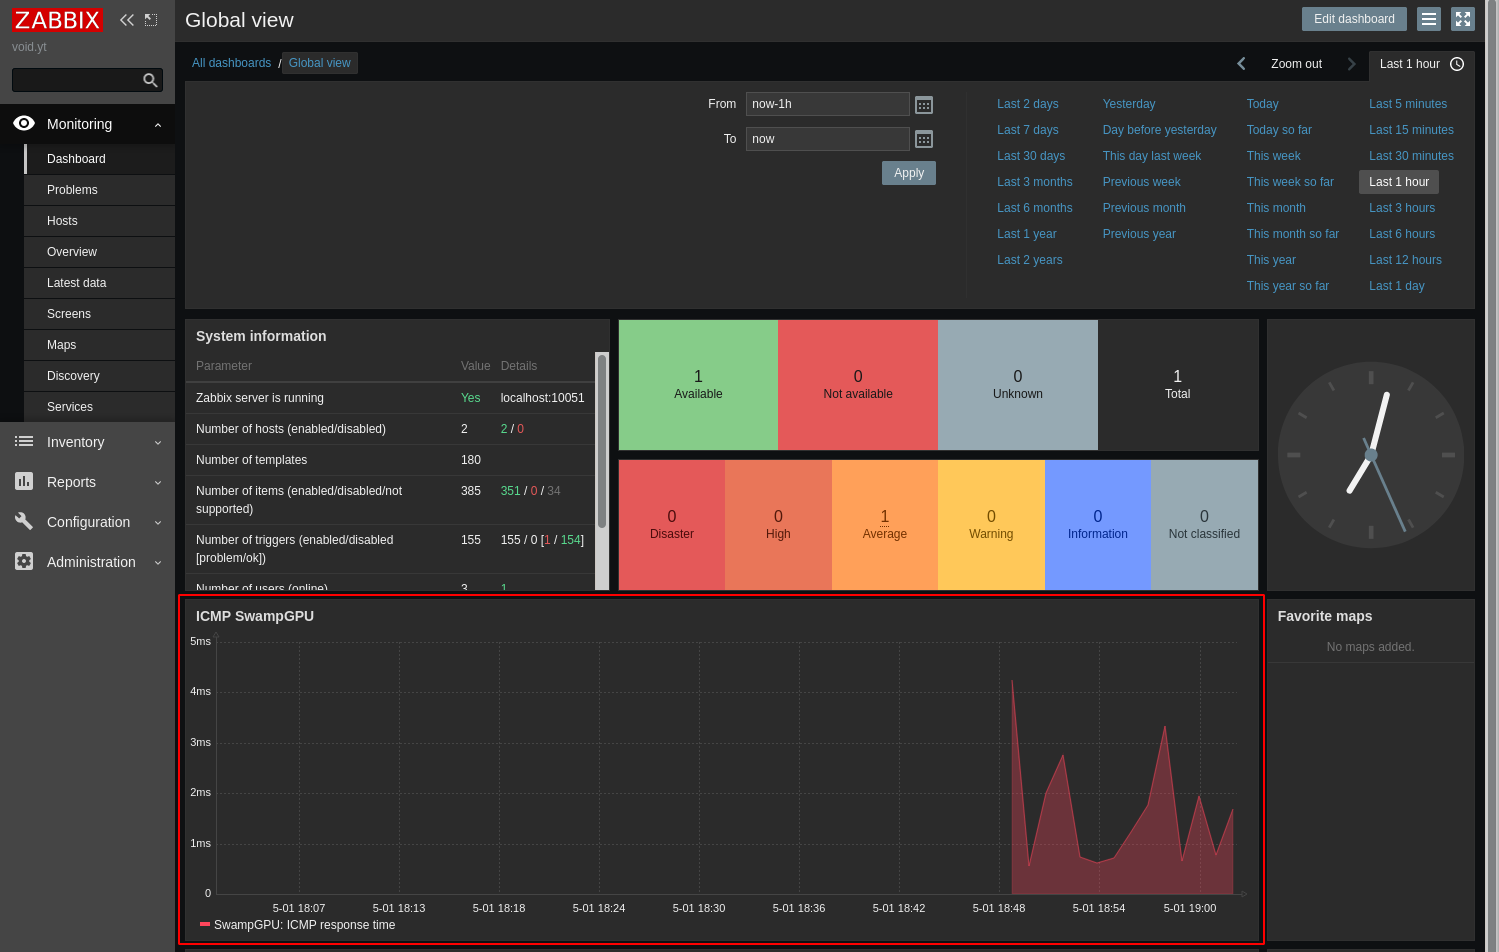
And there you go ! We managed to add a customized graph containing ICMP response time.
Now let's try to add Hosts using the Zabbix Agent:
root@Zabbix:~# ip a | grep inet
    inet 127.0.0.1/8 scope host lo
    inet6 ::1/128 scope host
    inet 10.0.0.220/16 brd 10.0.255.255 scope global ens18
    inet6 fe80::20f6:74ff:fe83:4fa3/64 scope link

root@Zabbix:~# apt install zabbix-agent
Reading package lists... Done
Building dependency tree
Reading state information... Done
zabbix-agent is already the newest version (1:5.2.6-1+debian10).
0 upgraded, 0 newly installed, 0 to remove and 0 not upgraded.

root@Zabbix:~# systemctl enable --now zabbix-agent
Another example for the 10.0.0.101 host:
root@home:~# ip a | grep inet
    inet 127.0.0.1/8 scope host lo
    inet6 ::1/128 scope host
    inet 10.0.0.101/16 brd 10.0.255.255 scope global ens18
    inet6 fe80::94b0:53ff:fe08:49a6/64 scope link

root@home:~# apt install zabbix-agent -y
Reading package lists... Done
Building dependency tree
Reading state information... Done
zabbix-agent is already the newest version (1:4.0.4+dfsg-1).
0 upgraded, 0 newly installed, 0 to remove and 0 not upgraded.

root@home:~# vim /etc/zabbix/zabbix_agentd.conf

[...]

Server=0.0.0.0/0

ListenPort=10050

[...]

:wq

root@home:~# systemctl enable --now zabbix-agent

root@home:~# systemctl status zabbix-agent
● zabbix-agent.service - Zabbix Agent
   Loaded: loaded (/lib/systemd/system/zabbix-agent.service; enabled; vendor preset: enabled)
   Active: active (running) since Sat 2021-05-01 18:18:08 CEST; 5s ago
     Docs: man:zabbix_agentd
 Main PID: 30420 (zabbix_agentd)
    Tasks: 6 (limit: 4915)
   Memory: 3.1M
   CGroup: /system.slice/zabbix-agent.service
           ├─30420 /usr/sbin/zabbix_agentd --foreground
           ├─30421 /usr/sbin/zabbix_agentd: collector [idle 1 sec]
           ├─30422 /usr/sbin/zabbix_agentd: listener #1 [waiting for connection]
           ├─30423 /usr/sbin/zabbix_agentd: listener #2 [waiting for connection]
           ├─30424 /usr/sbin/zabbix_agentd: listener #3 [waiting for connection]
           └─30425 /usr/sbin/zabbix_agentd: active checks #1 [idle 1 sec]

May 01 18:18:08 home systemd[1]: Started Zabbix Agent.
May 01 18:18:08 home zabbix_agentd[30420]: Starting Zabbix Agent [home]. Zabbix 4.0.4 (revision 89349).
May 01 18:18:08 home zabbix_agentd[30420]: Press Ctrl+C to exit.
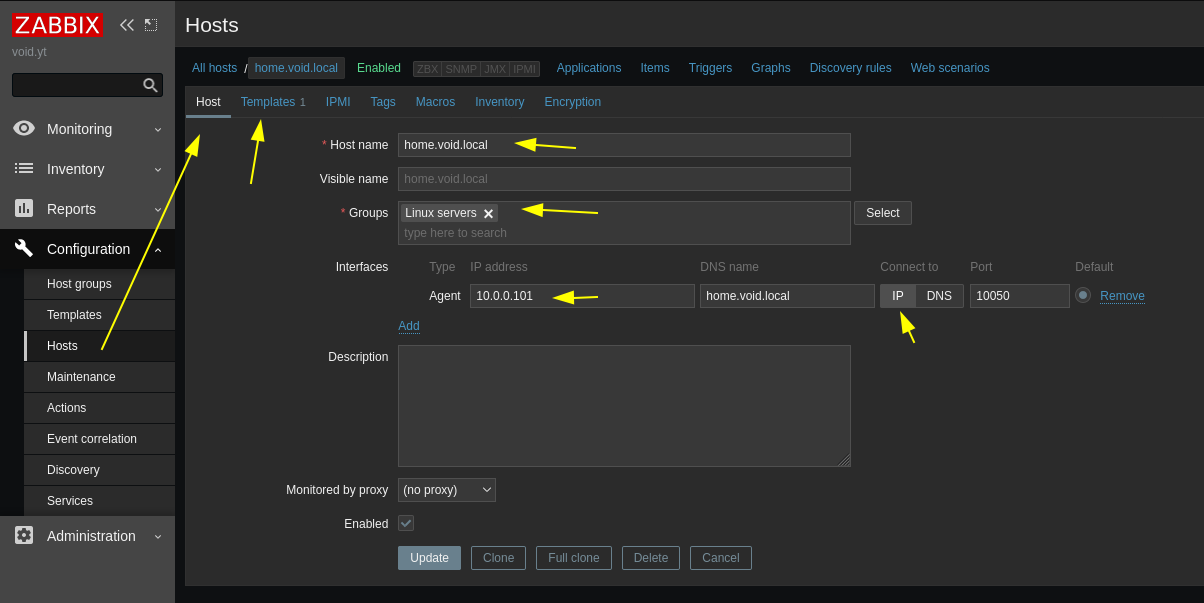
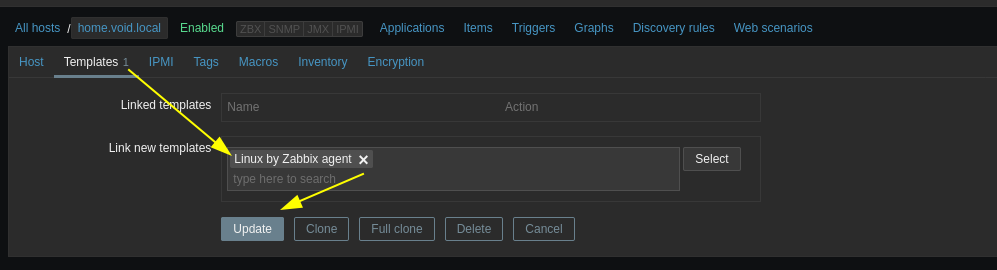
Now just add the 2 Hosts:
And with this we can add for example their CPU utilization:
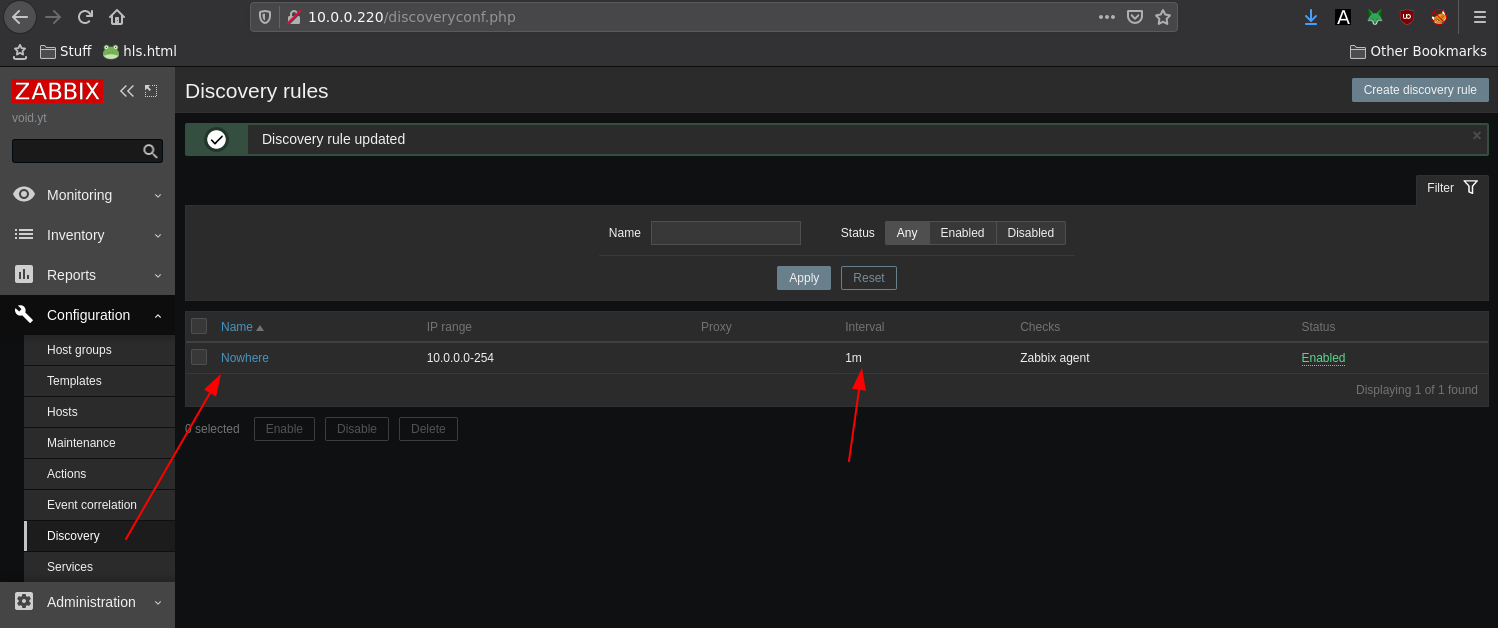
If you want to monitor hosts by ICMP only do the following:
root@Zabbix:~# apt install fping -y
Reading package lists... Done
Building dependency tree
Reading state information... Done
fping is already the newest version (4.2-1).
fping set to manually installed.
0 upgraded, 0 newly installed, 0 to remove and 0 not upgraded.

root@Zabbix:~# which fping
/usr/bin/fping


root@Zabbix:~# vim /etc/zabbix/zabbix_server.conf

[...]
FpingLocation=/usr/bin/fping

StartPingers=100

Timeout=4
[...]

:wq

root@Zabbix:~# systemctl restart zabbix-server
Then add the host itself:
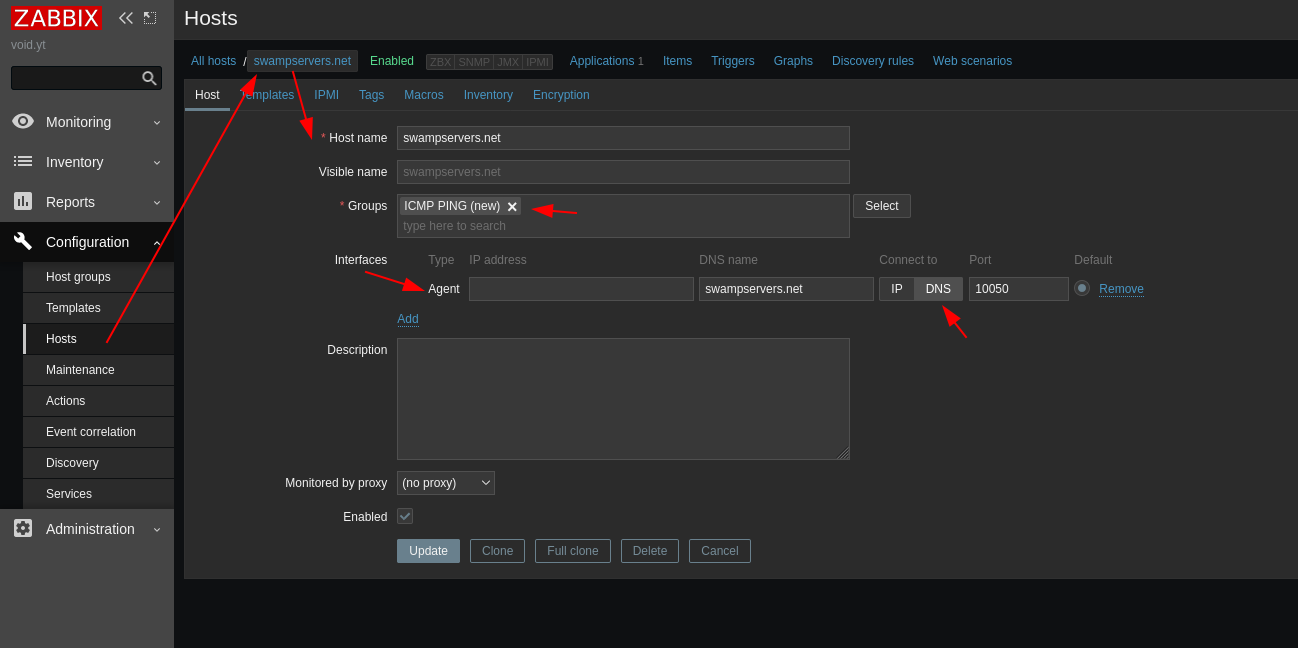
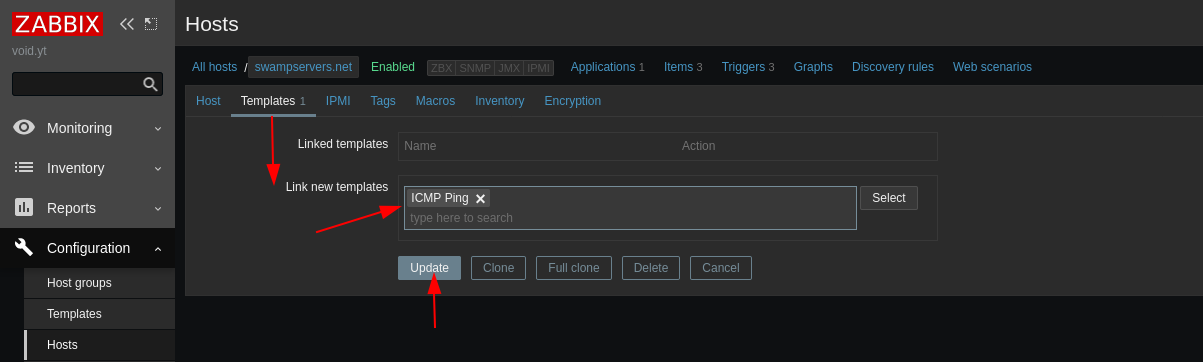
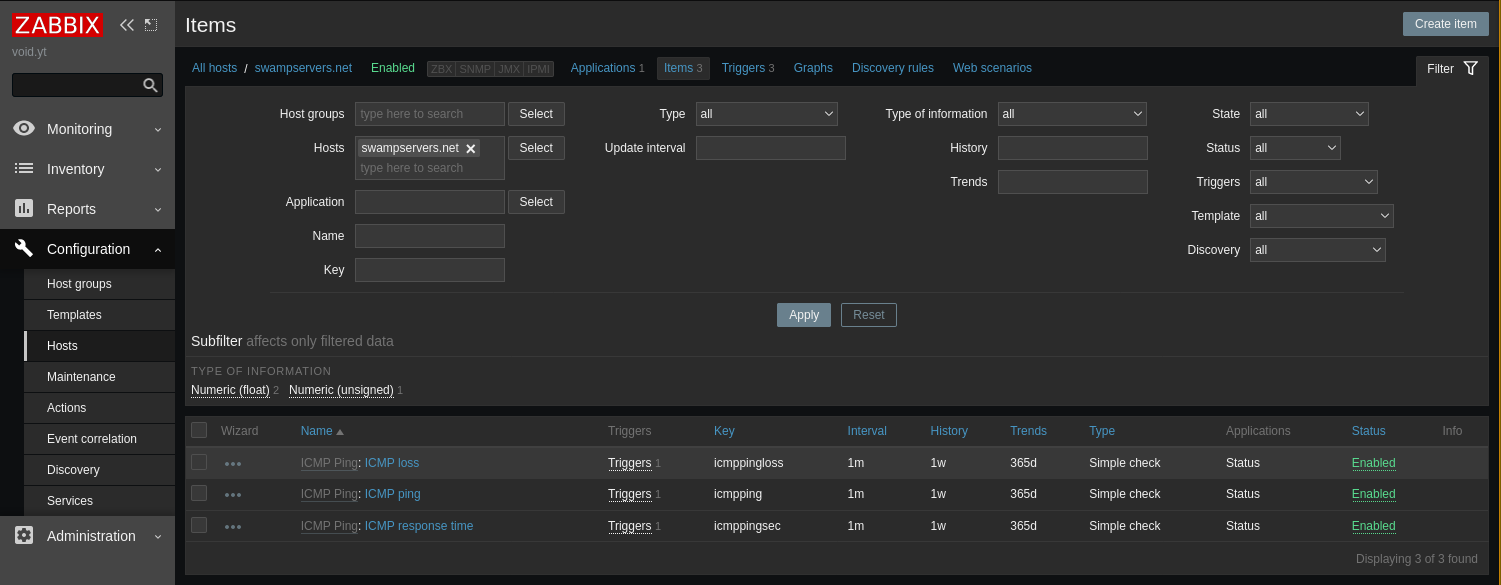
Once you created the host with the ICMP Ping template, you can check it's new items:
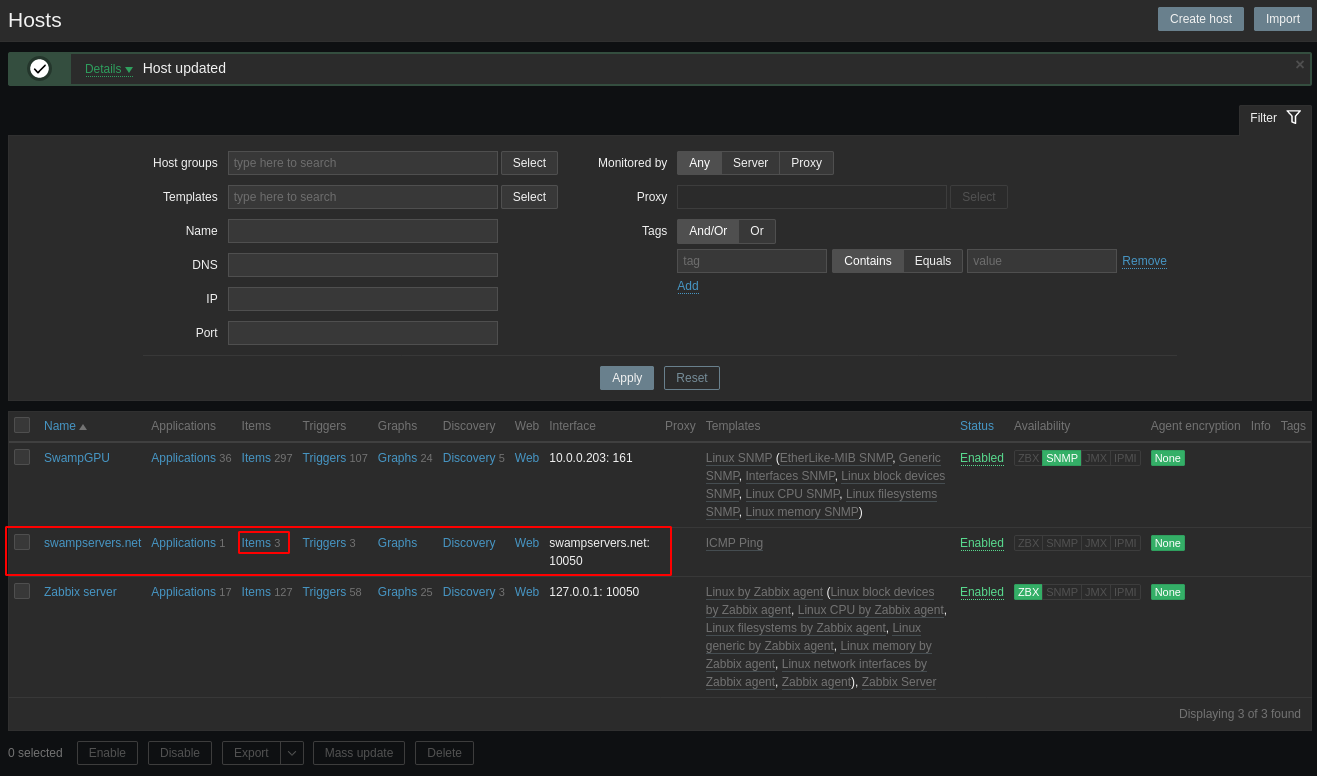
ANd now that's done, we can add it to our dashboard:
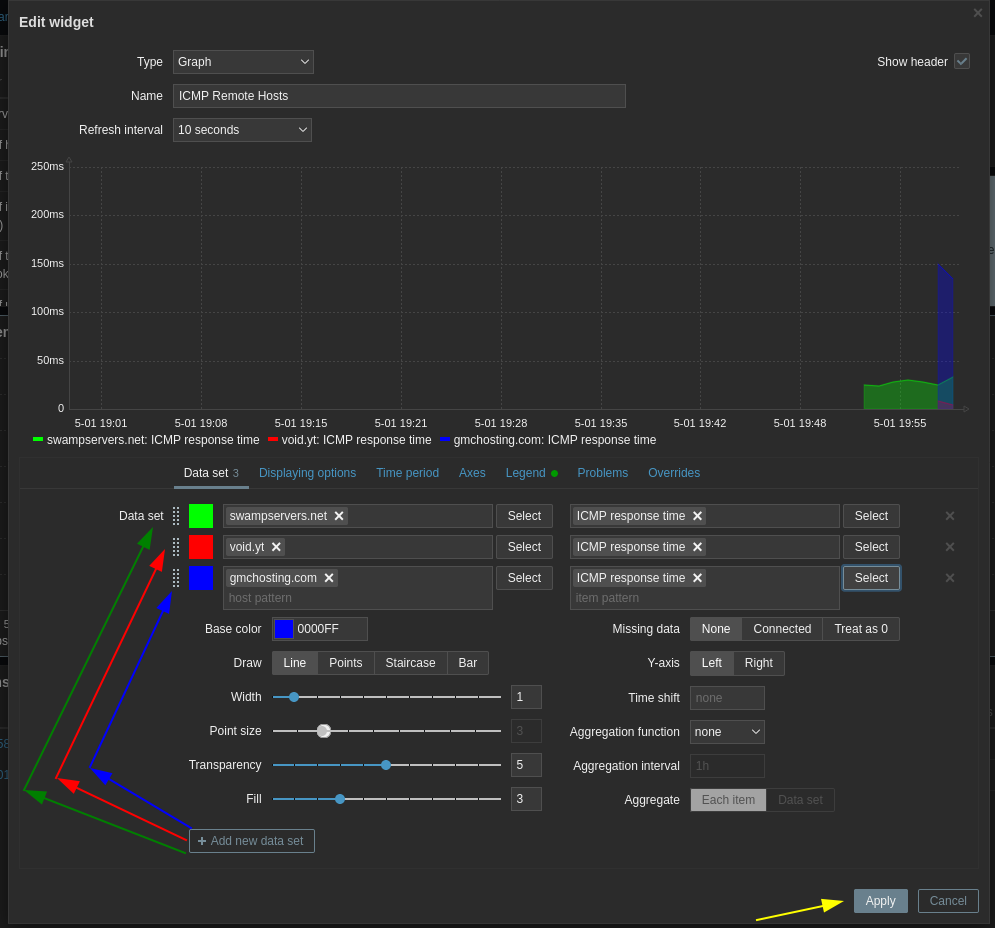
Here's an example with 3 hosts:
After using zabbix for approximately 3 months, here's what it ends up like:
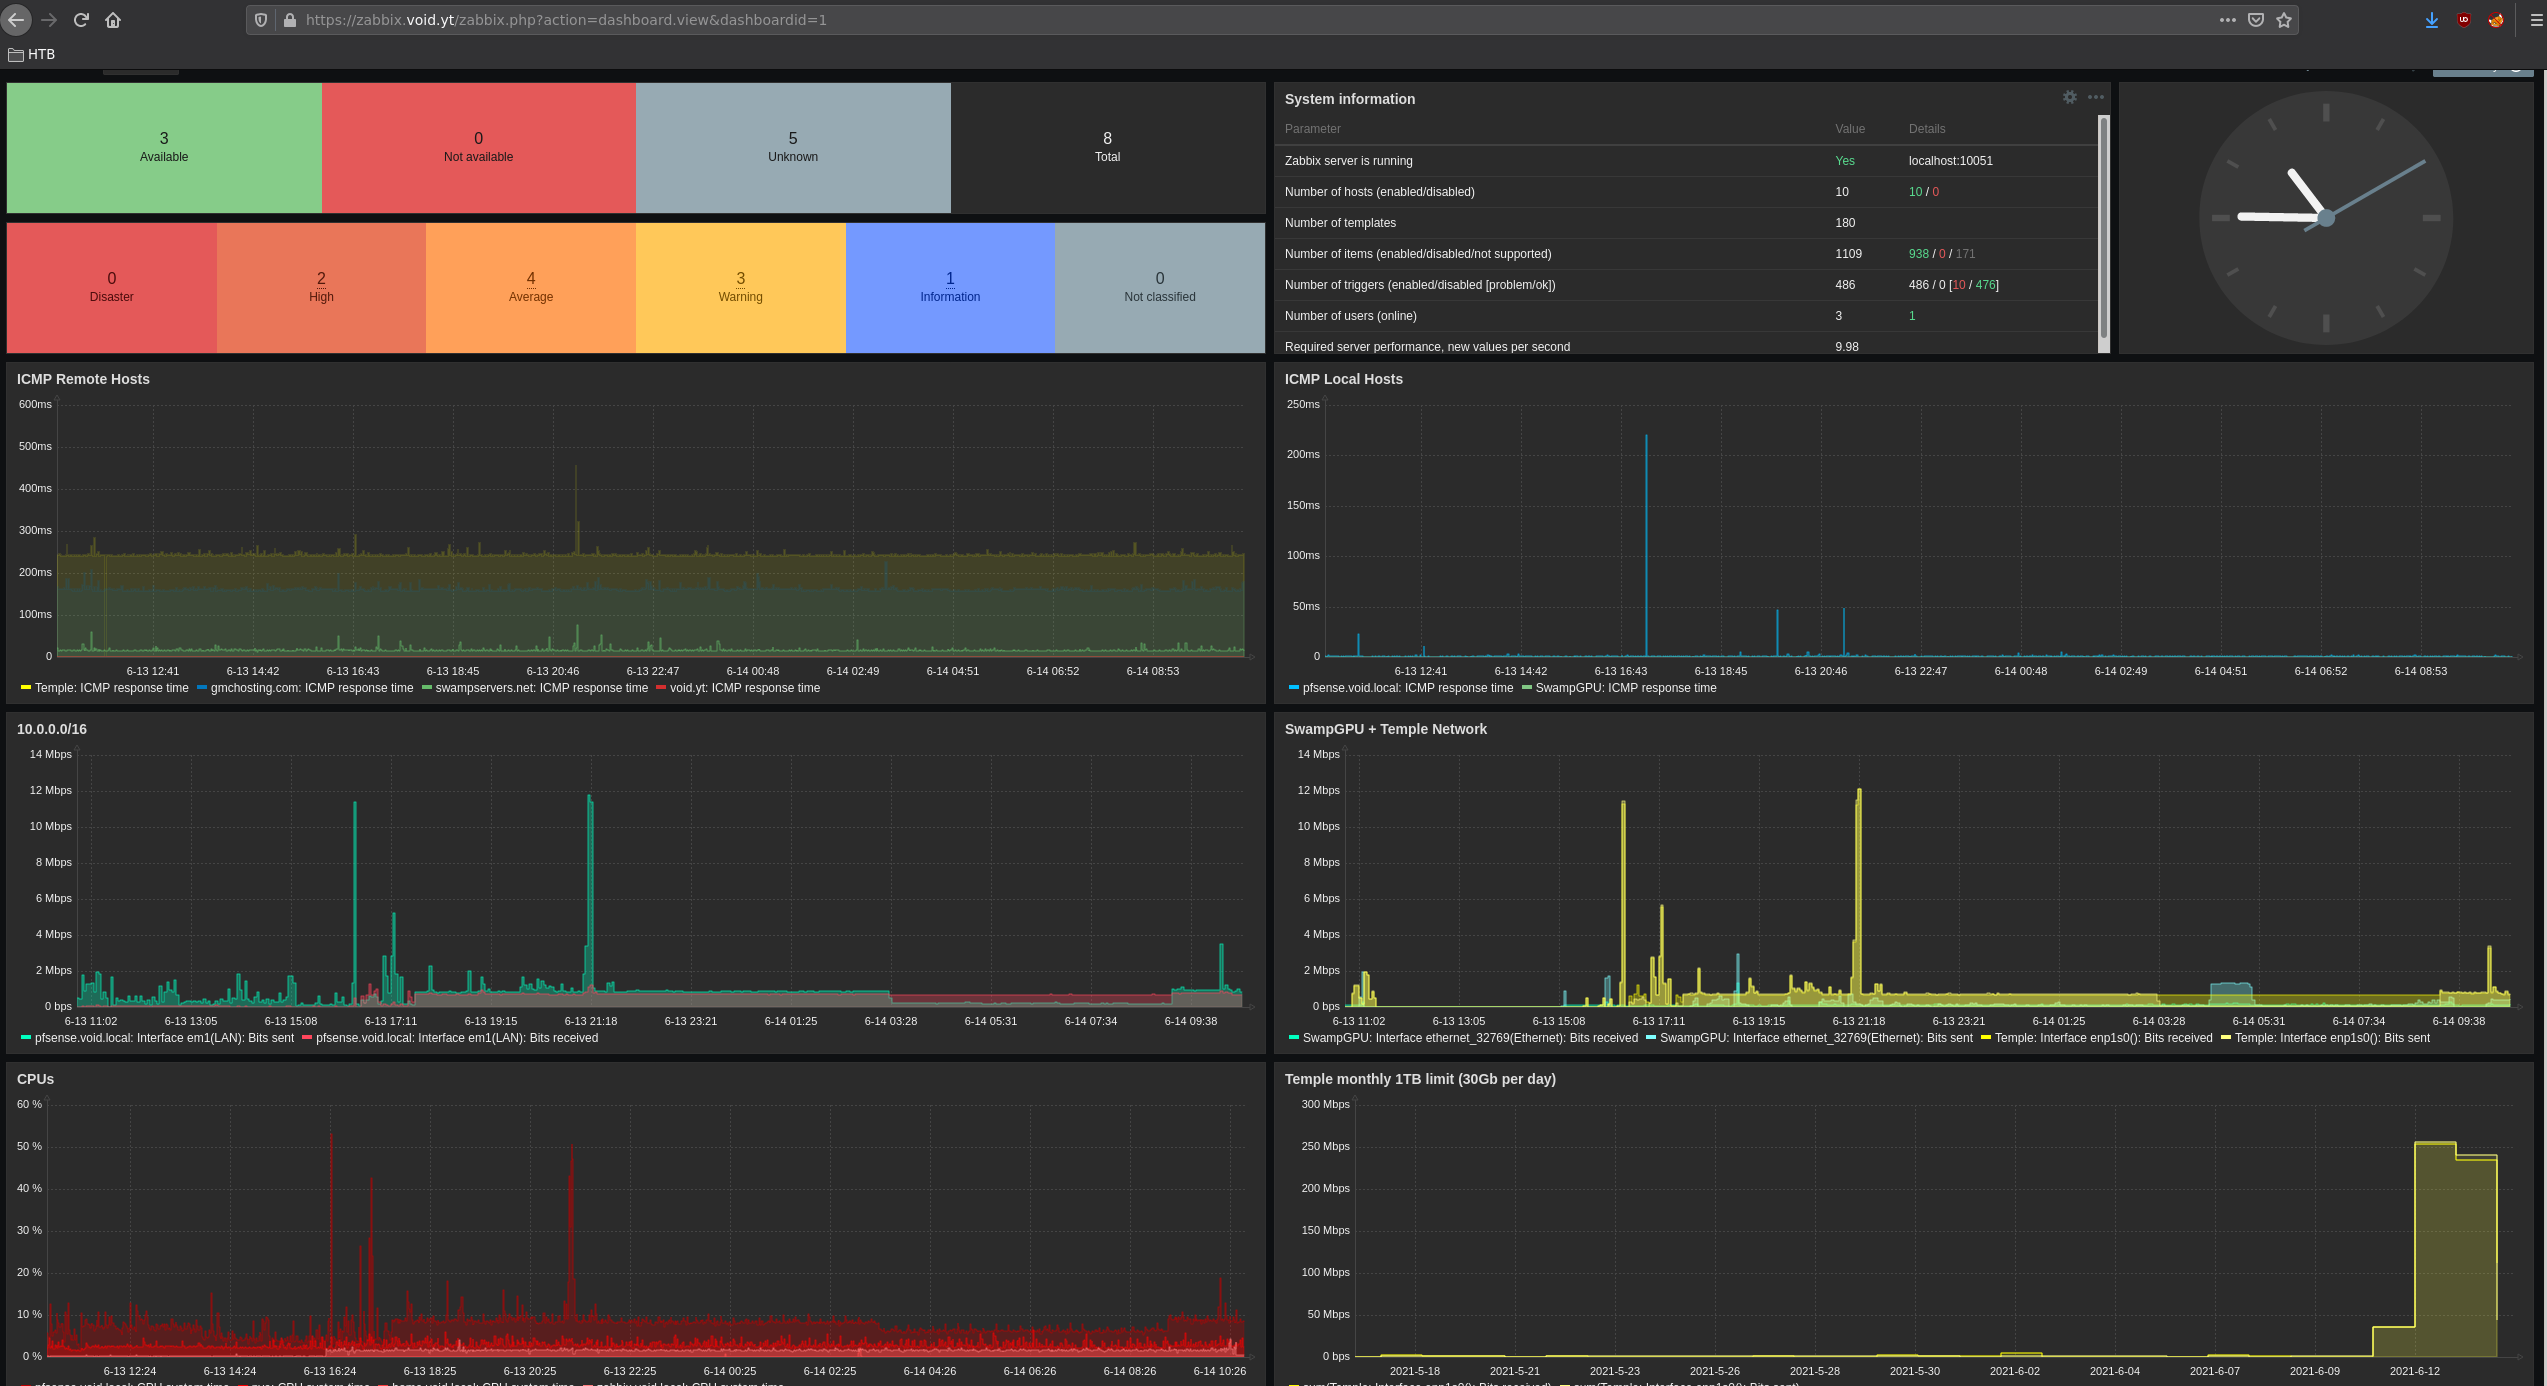
Right now i have a VPS with a monthly 1TB bandwidth limit, so i need to monitor it. To do so i use snmp and vnstat:
[ 10.66.66.2/32 ] [ /dev/pts/27 ] [~/Documents/Github]
→ ssh temple

root@Temple:~# apt install vnstat -y

root@Temple:~# systemctl enable vnstat
Synchronizing state of vnstat.service with SysV service script with /lib/systemd/systemd-sysv-install.
Executing: /lib/systemd/systemd-sysv-install enable vnstat

root@Temple:~# systemctl status vnstat
● vnstat.service - vnStat network traffic monitor
     Loaded: loaded (/lib/systemd/system/vnstat.service; enabled; vendor preset: enabled)
     Active: active (running) since Mon 2021-06-14 08:37:10 UTC; 2min 50s ago
       Docs: man:vnstatd(8)
             man:vnstat(1)
             man:vnstat.conf(5)
   Main PID: 13780 (vnstatd)
      Tasks: 1 (limit: 1040)
     Memory: 864.0K
     CGroup: /system.slice/vnstat.service
             └─13780 /usr/sbin/vnstatd -n

Jun 14 08:37:10 Temple systemd[1]: Started vnStat network traffic monitor.
Jun 14 08:37:10 Temple vnstatd[13780]: No interfaces found in database, adding available interfaces...
Jun 14 08:37:10 Temple vnstatd[13780]: Interface "enp1s0" added with 1000 Mbit bandwidth limit.
Jun 14 08:37:10 Temple vnstatd[13780]: Interface "wg0" added with 1000 Mbit bandwidth limit.
Jun 14 08:37:10 Temple vnstatd[13780]: -> 2 new interfaces found.
Jun 14 08:37:10 Temple vnstatd[13780]: Limits can be modified using the configuration file. See "man vnstat.conf".
Jun 14 08:37:10 Temple vnstatd[13780]: Unwanted interfaces can be removed from monitoring with "vnstat --remove".
Jun 14 08:37:10 Temple vnstatd[13780]: Info: vnStat daemon 2.6 started. (pid:13780 uid:114 gid:119 64-bit)
Jun 14 08:37:10 Temple vnstatd[13780]: Info: Monitoring (2): wg0 (1000 Mbit) enp1s0 (1000 Mbit)
Now that we enabled the vnstat service, we can monitor our bandwidth usage from the commandline and as you can see from the service status output, it is monitoring the enp1s0 and wg0 interfaces:
root@Temple:~# vnstat -i wg0
Database updated: 2021-06-14 08:42:20

   wg0 since 2021-06-14

          rx:  23.83 MiB      tx:  25.43 MiB      total:  49.26 MiB

   monthly
                     rx      |     tx      |    total    |   avg. rate
     ------------------------+-------------+-------------+---------------
       2021-06     23.83 MiB |   25.43 MiB |   49.26 MiB |      357 bit/s
     ------------------------+-------------+-------------+---------------
     estimated     51.91 MiB |   56.85 MiB |  108.76 MiB |

   daily
                     rx      |     tx      |    total    |   avg. rate
     ------------------------+-------------+-------------+---------------
         today     23.83 MiB |   25.43 MiB |   49.26 MiB |   13.19 kbit/s
     ------------------------+-------------+-------------+---------------
     estimated     65.75 MiB |   70.15 MiB |  135.90 MiB |

root@Temple:~# vnstat -i enp1s0
Database updated: 2021-06-14 08:42:20

   enp1s0 since 2021-06-14

          rx:  25.02 MiB      tx:  26.66 MiB      total:  51.68 MiB

   monthly
                     rx      |     tx      |    total    |   avg. rate
     ------------------------+-------------+-------------+---------------
       2021-06     25.02 MiB |   26.66 MiB |   51.68 MiB |      375 bit/s
     ------------------------+-------------+-------------+---------------
     estimated     54.38 MiB |   59.33 MiB |  113.71 MiB |

   daily
                     rx      |     tx      |    total    |   avg. rate
     ------------------------+-------------+-------------+---------------
         today     25.02 MiB |   26.66 MiB |   51.68 MiB |   13.83 kbit/s
     ------------------------+-------------+-------------+---------------
     estimated     69.03 MiB |   73.54 MiB |  142.57 MiB |
Currently i have 2 network interfaces i want to monitor: enp1s0 and wg0. Now the goal for me is to monitor the monthly total bandwidth usage, so that i can monitor if i'm going to hit the limit or not.
root@Temple:~# vnstat

                      rx      /      tx      /     total    /   estimated
 enp1s0:
       2021-06     66.75 MiB  /   70.79 MiB  /  137.54 MiB  /  306.52 MiB
         today     66.75 MiB  /   70.79 MiB  /  137.54 MiB  /  373.70 MiB

 wg0:
       2021-06     59.36 MiB  /   67.49 MiB  /  126.86 MiB  /  281.80 MiB
         today     59.36 MiB  /   67.49 MiB  /  126.86 MiB  /  344.66 MiB

root@Temple:~# vnstat --oneline
1;enp1s0;2021-06-14;66.75 MiB;70.79 MiB;137.54 MiB;36.28 kbit/s;2021-06;66.75 MiB;70.79 MiB;137.54 MiB;998 bit/s;66.75 MiB;70.79 MiB;137.54 MiB

root@Temple:~# vnstat --oneline | awk -F\; '{ print $11 }'
137.54 MiB
Basically for me the wg0 bandwidth usage is included in the enp1s0 bandwidth usage. Therefore i only need to monitor the enp1s0 interface, so i end up with the following bashscript:
root@Temple:~# vim bandwidth.sh

#!/bin/bash
# Current month total bandwidth in MB

i=$(vnstat --oneline | awk -F\; '{ print $11 }')

bandwidth_number=$(echo $i | awk '{ print $1 }')
bandwidth_unit=$(echo $i | awk '{ print $2 }')

#echo "$i "
#echo "$bandwidth_number"
#echo "$bandwidth_unit"

case "$bandwidth_unit" in
        KiB)    bandwidth_number_MB=$(echo "$bandwidth_number/1024" | bc)
        ;;
        MiB)    bandwidth_number_MB=$bandwidth_number
        ;;
        GiB)     bandwidth_number_MB=$(echo "$bandwidth_number*1024" | bc)
        ;;
        TiB)    bandwidth_number_MB=$(echo "$bandwidth_number*1024*1024" | bc)
        ;;
esac


echo $bandwidth_number_MB

:wq

root@Temple:~# chmod +x bandwidth.sh

root@Temple:~# ./bandwidth.sh

root@Temple:~# ./bandwidth.sh
195.35

root@Temple:~# cp bandwidth.sh /usr/local/bin/bandwidth
root@Temple:~# chmod +x /usr/local/bin/bandwidth
root@Temple:~# /usr/local/bin/bandwidth
314.77
Now we have a script which gives us the bandwidth usage in MiB. Now we need to make sure that zabbix can retrieve that information and use it in the graphs. We will modify our snmpd.conf file:
root@Temple:~# vim /etc/snmp/snmpd.conf

[...]

# This line allows Observium to detect the host OS if the distro script is installed
extend .1.3.6.1.4.1.2021.7890.1 distro /usr/local/bin/distro

# check bandwidth usage
extend .1.3.6.1.4.1.53864.1.1 bandwidth /usr/local/bin/bandwidth

[...]

:wq

root@Temple:~# systemctl restart snmpd
Now that you modified the snmpd config and restarted the service, you should be able to use the OID that corresponds to the bandwidth script from snmpwalk:
[ 10.66.66.2/32 ] [ /dev/pts/28 ] [~/Documents/Github]
→ snmpwalk -v2c temple.void.yt -c void.yt .1.3.6.1.4.1.53864.1.1
iso.3.6.1.4.1.53864.1.1.1.0 = INTEGER: 1
iso.3.6.1.4.1.53864.1.1.2.1.2.9.98.97.110.100.119.105.100.116.104 = STRING: "/usr/local/bin/bandwidth"
iso.3.6.1.4.1.53864.1.1.2.1.3.9.98.97.110.100.119.105.100.116.104 = ""
iso.3.6.1.4.1.53864.1.1.2.1.4.9.98.97.110.100.119.105.100.116.104 = ""
iso.3.6.1.4.1.53864.1.1.2.1.5.9.98.97.110.100.119.105.100.116.104 = INTEGER: 5
iso.3.6.1.4.1.53864.1.1.2.1.6.9.98.97.110.100.119.105.100.116.104 = INTEGER: 1
iso.3.6.1.4.1.53864.1.1.2.1.7.9.98.97.110.100.119.105.100.116.104 = INTEGER: 1
iso.3.6.1.4.1.53864.1.1.2.1.20.9.98.97.110.100.119.105.100.116.104 = INTEGER: 4
iso.3.6.1.4.1.53864.1.1.2.1.21.9.98.97.110.100.119.105.100.116.104 = INTEGER: 1
iso.3.6.1.4.1.53864.1.1.3.1.1.9.98.97.110.100.119.105.100.116.104 = STRING: "364.55"
iso.3.6.1.4.1.53864.1.1.3.1.2.9.98.97.110.100.119.105.100.116.104 = STRING: "364.55"
iso.3.6.1.4.1.53864.1.1.3.1.3.9.98.97.110.100.119.105.100.116.104 = INTEGER: 1
iso.3.6.1.4.1.53864.1.1.3.1.4.9.98.97.110.100.119.105.100.116.104 = INTEGER: 0
iso.3.6.1.4.1.53864.1.1.4.1.2.9.98.97.110.100.119.105.100.116.104.1 = STRING: "364.55"
And there you go! We have been able to query our monthly bandwidth usage integer. So now we need to get zabbix to query that specific oid aswell.
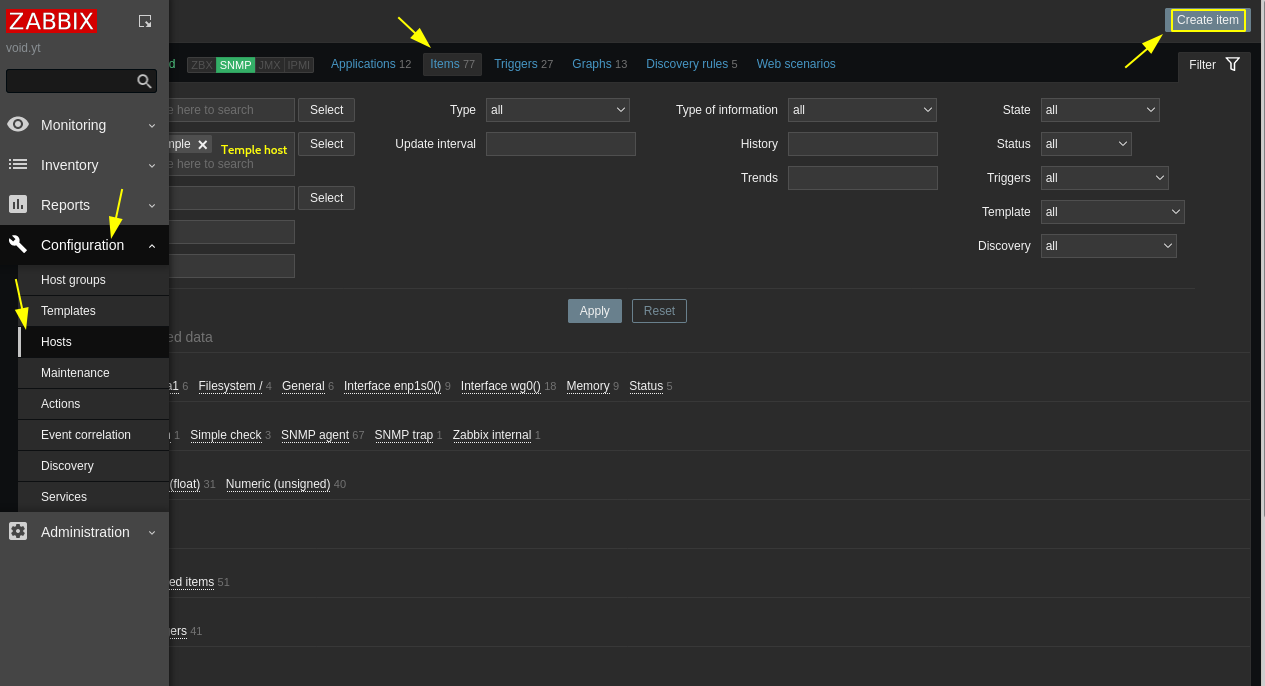
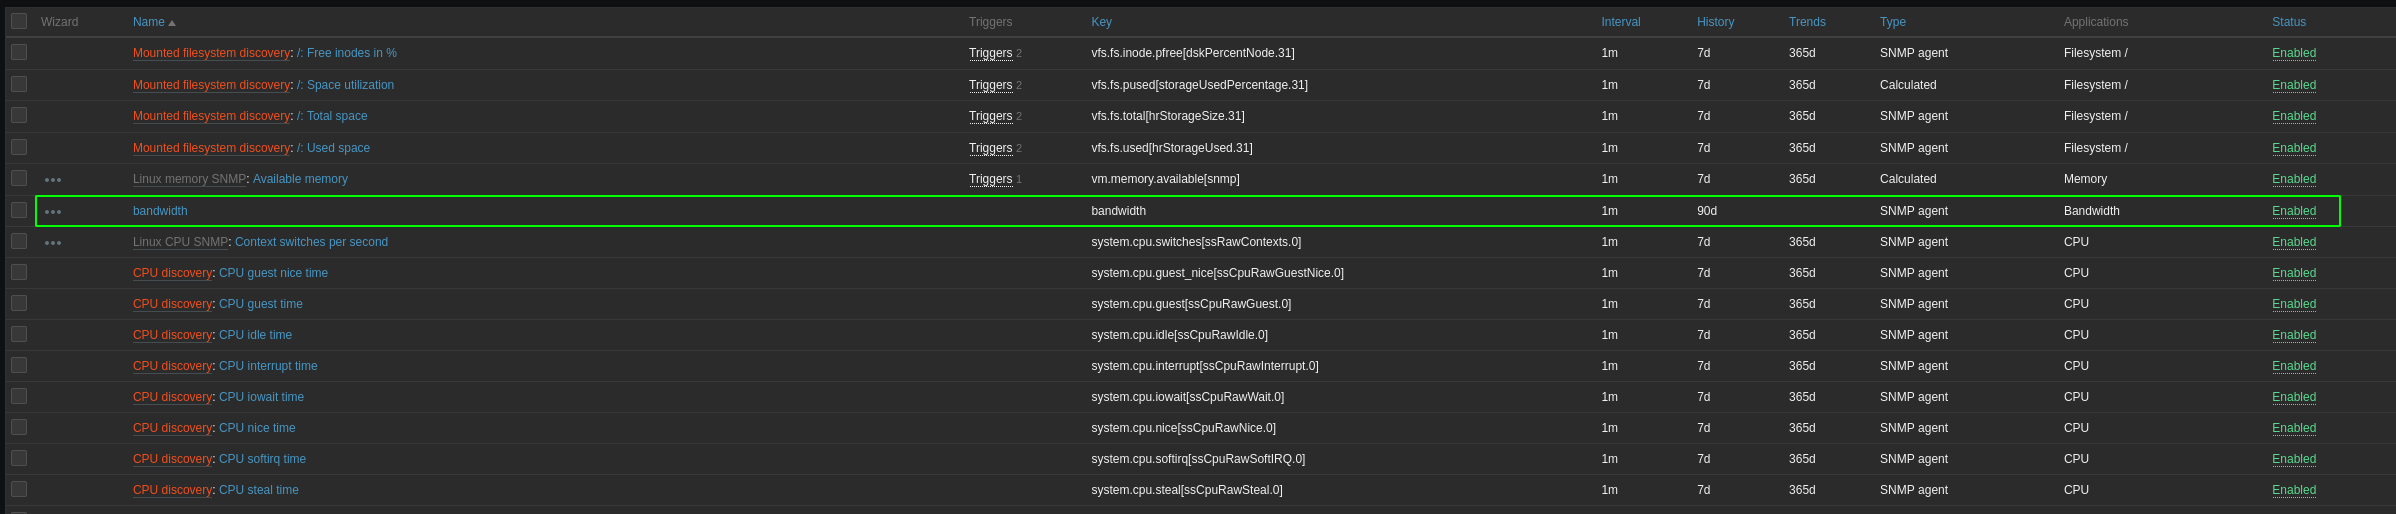
Here we're basically going to create an iten for our current snmp host called Temple:
[ 10.66.66.2/32 ] [ /dev/pts/29 ] [~/Documents/Github]
→ snmpget -v 2c -c void.yt temple.void.yt .1.3.6.1.4.1.53864.1.1
iso.3.6.1.4.1.53864.1.1 = No Such Object available on this agent at this OID

[ 10.66.66.2/32 ] [ /dev/pts/29 ] [~/Documents/Github]
→ snmpwalk -v2c temple.void.yt -c void.yt .1.3.6.1.4.1.53864.1.1
iso.3.6.1.4.1.53864.1.1.1.0 = INTEGER: 1
iso.3.6.1.4.1.53864.1.1.2.1.2.9.98.97.110.100.119.105.100.116.104 = STRING: "/usr/local/bin/bandwidth"
iso.3.6.1.4.1.53864.1.1.2.1.3.9.98.97.110.100.119.105.100.116.104 = ""
iso.3.6.1.4.1.53864.1.1.2.1.4.9.98.97.110.100.119.105.100.116.104 = ""
iso.3.6.1.4.1.53864.1.1.2.1.5.9.98.97.110.100.119.105.100.116.104 = INTEGER: 5
iso.3.6.1.4.1.53864.1.1.2.1.6.9.98.97.110.100.119.105.100.116.104 = INTEGER: 1
iso.3.6.1.4.1.53864.1.1.2.1.7.9.98.97.110.100.119.105.100.116.104 = INTEGER: 1
iso.3.6.1.4.1.53864.1.1.2.1.20.9.98.97.110.100.119.105.100.116.104 = INTEGER: 4
iso.3.6.1.4.1.53864.1.1.2.1.21.9.98.97.110.100.119.105.100.116.104 = INTEGER: 1
iso.3.6.1.4.1.53864.1.1.3.1.1.9.98.97.110.100.119.105.100.116.104 = STRING: "699.06"
iso.3.6.1.4.1.53864.1.1.3.1.2.9.98.97.110.100.119.105.100.116.104 = STRING: "699.06"
iso.3.6.1.4.1.53864.1.1.3.1.3.9.98.97.110.100.119.105.100.116.104 = INTEGER: 1
iso.3.6.1.4.1.53864.1.1.3.1.4.9.98.97.110.100.119.105.100.116.104 = INTEGER: 0
iso.3.6.1.4.1.53864.1.1.4.1.2.9.98.97.110.100.119.105.100.116.104.1 = STRING: "699.06"

[ 10.66.66.2/32 ] [ /dev/pts/29 ] [~/Documents/Github]
→ snmpget -v 2c -c void.yt temple.void.yt iso.3.6.1.4.1.53864.1.1.3.1.1.9.98.97.110.100.119.105.100.116.104
iso.3.6.1.4.1.53864.1.1.3.1.1.9.98.97.110.100.119.105.100.116.104 = STRING: "699.06"
If you pick the oid ending in .1.1 you will get the 'No such Object available on this agent at this OID' error. So when we do snmpwalk we see that the full OID is iso.3.6.1.4.1.53864.1.1.3.1.1.9.98.97.110.100.119.105.100.116.104. So we add it accordingly to our custom zabbix item:
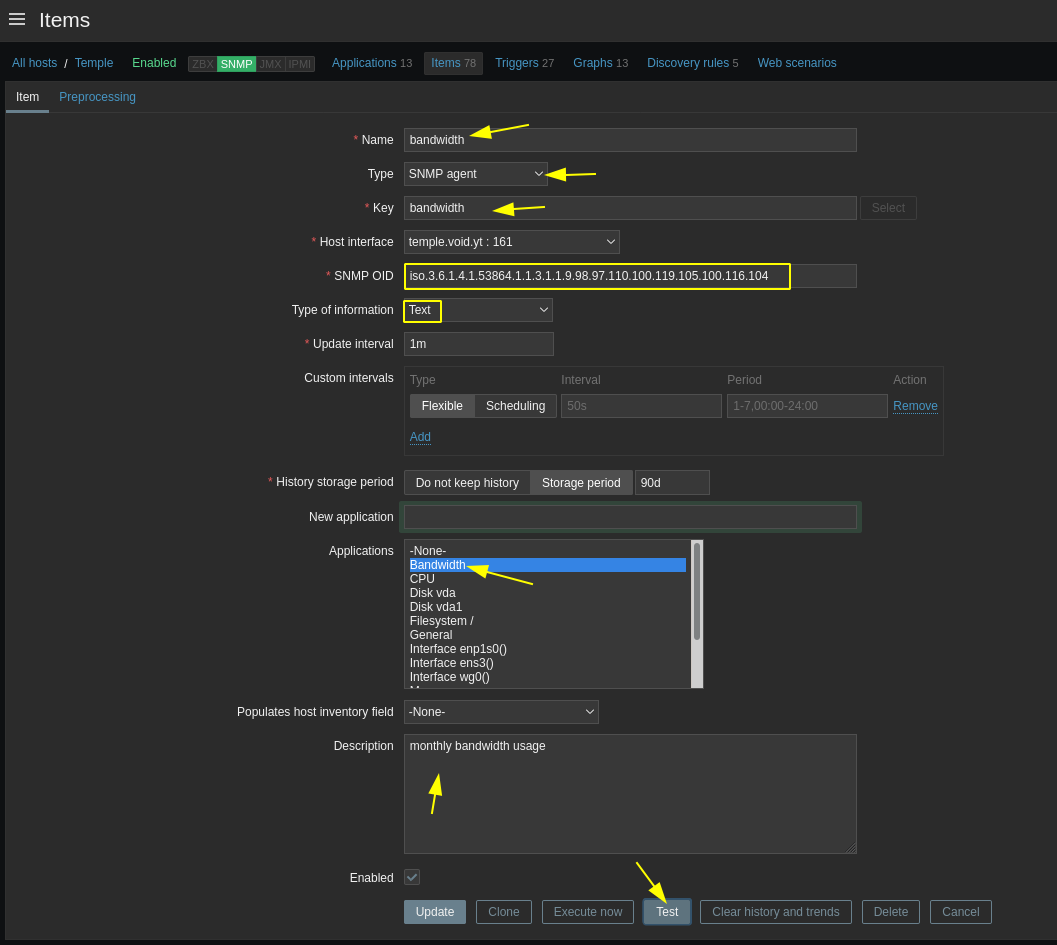
We can test the OID here aswell:
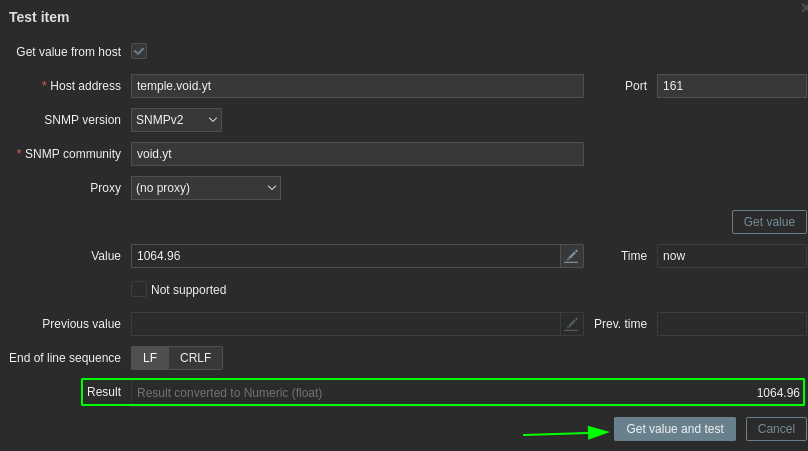
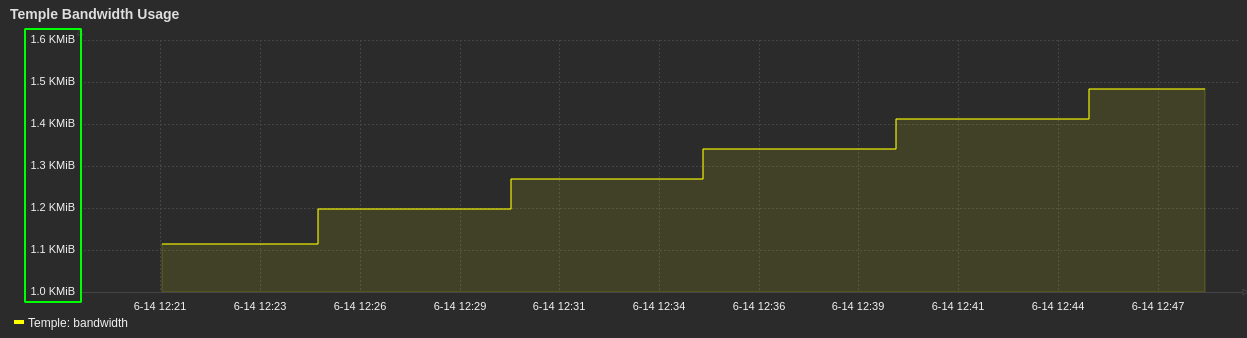
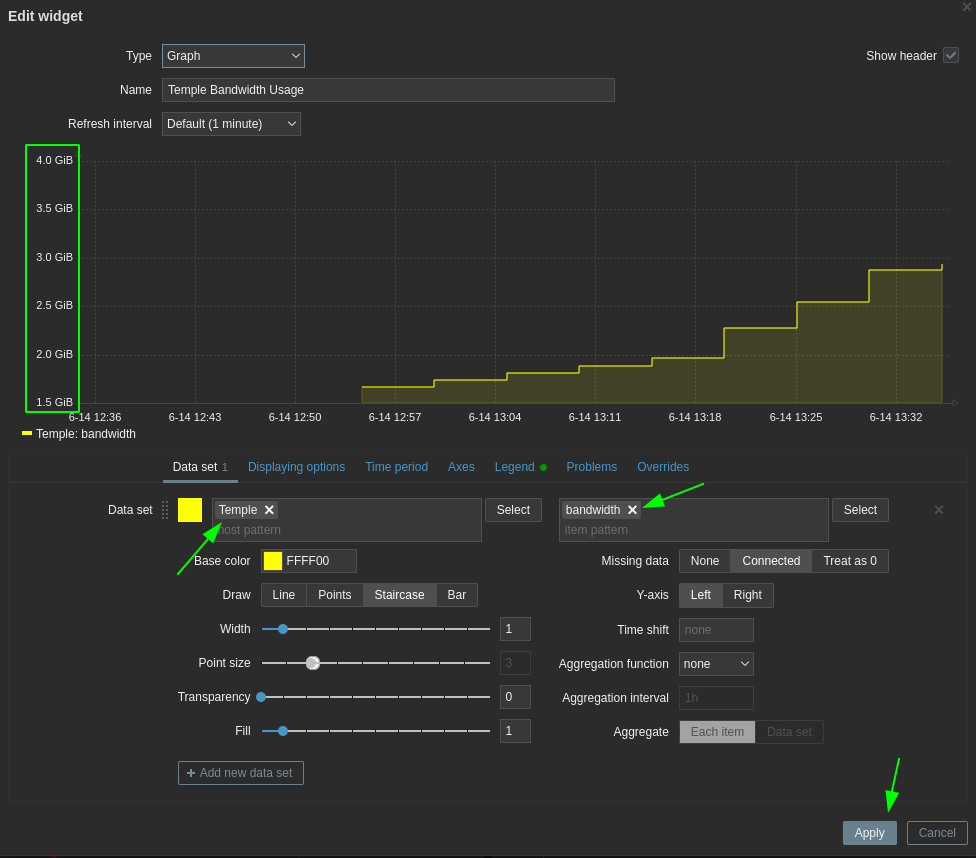
And here we see that it is getting the right value ! So we can add it to our graphs:
Now here we see a problem with the units of the graph, we see that zabbix wants the base unit to be in iB because it will add the K M G T behind it. so let's simply edit our bandwidth script:
root@Temple:~# vim /usr/local/bin/bandwidth

#echo "$i "
#echo "$bandwidth_number"
#echo "$bandwidth_unit"

case "$bandwidth_unit" in
        KiB)    bandwidth_number_B=$(echo "$bandwidth_number*1024" | bc)
        ;;
        MiB)    bandwidth_number_B=$(echo "$bandwidth_number*1024*1024" | bc)
        ;;
        GiB)    bandwidth_number_B=$(echo "$bandwidth_number*1024*1024*1024" | bc)
        ;;
        TiB)    bandwidth_number_B=$(echo "$bandwidth_number*1024*1024*1024*1024" | bc)
        ;;
esac


echo $bandwidth_number_B

:wq

root@Temple:~# /usr/local/bin/bandwidth
1621350154.24
Now we have the Bytes instead of MegaBytes, so we clear the zabbix data for the bandwidth item and then check our graph again:
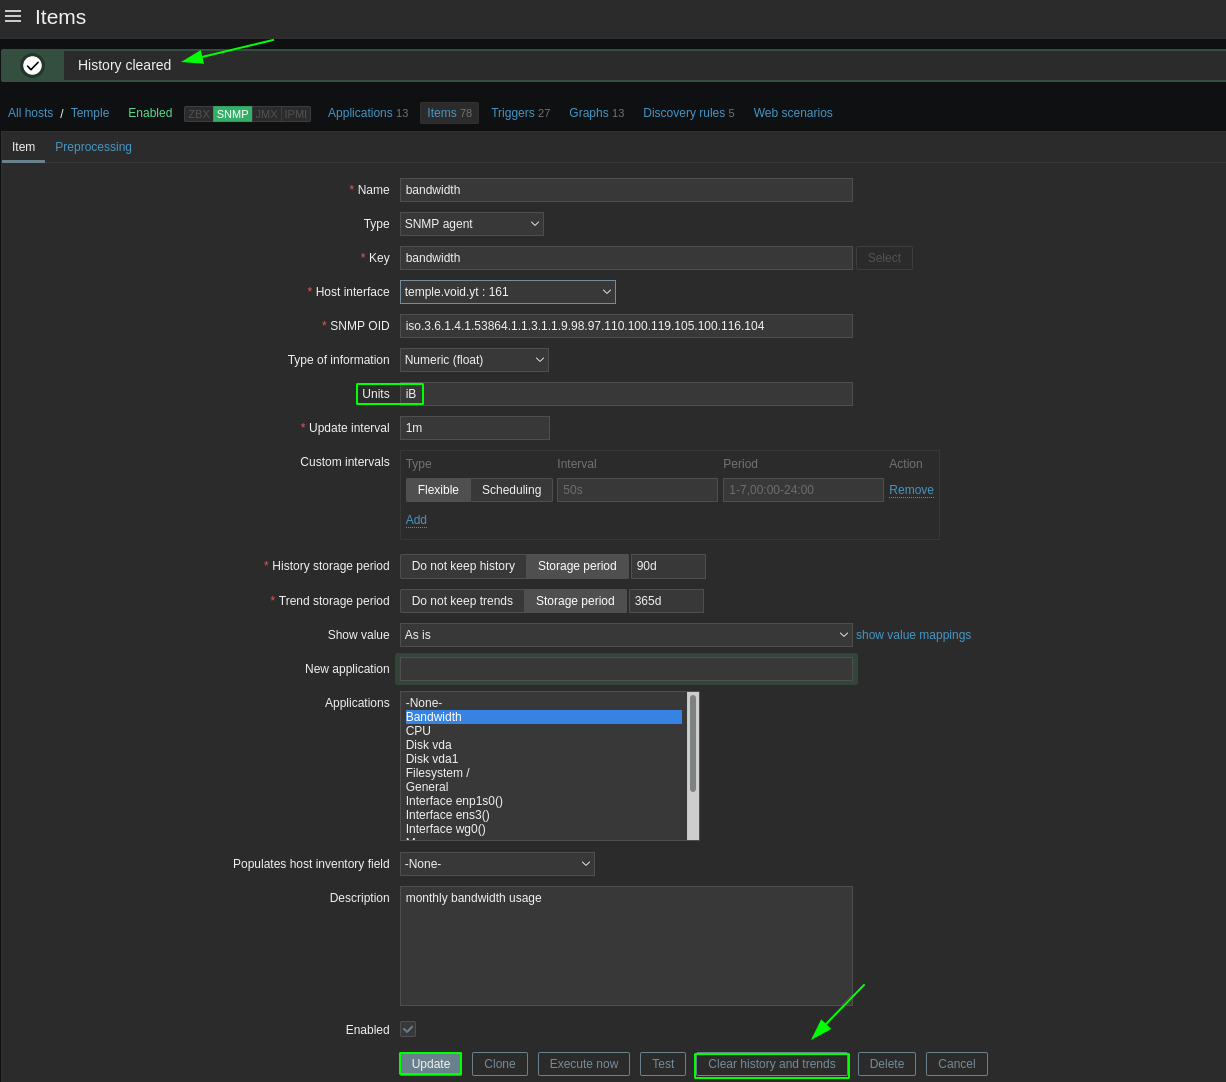
And here you see we have the correct units to monitor monthly bandwidth usage.
EDIT: apparently Vultr measures bandwidth in a weird way. They basically take the inbound traffic and the outbound traffic independently, and only take into account the higher of the 2 not the total of the 2. So here's my updated script:
#!/bin/bash
# Current month total bandwidth in MB

#i=$(vnstat --oneline | awk -F\; '{ print $11 }')

#DAILY
#i=$(vnstat --oneline | awk -F\; '{ print $4 }')
#j=$(vnstat --oneline | awk -F\; '{ print $5 }')

#MONTHLY
i=$(vnstat --oneline | awk -F\; '{ print $9 }')
j=$(vnstat --oneline | awk -F\; '{ print $10 }')

bn1=$(echo $i | awk '{ print $1 }')
bn2=$(echo $j | awk '{ print $1 }')


bunit1=$(echo $i | awk '{ print $2 }')
bunit2=$(echo $j | awk '{ print $2 }')

case "$bunit1" in
        KiB)    bnB1=$(echo "$bn1*1024" | bc)
        ;;
        MiB)    bnB1=$(echo "$bn1*1024*1024" | bc)
        ;;
        GiB)    bnB1=$(echo "$bn1*1024*1024*1024" | bc)
        ;;
        TiB)    bnB1=$(echo "$bn1*1024*1024*1024*1024" | bc)
        ;;
esac

case "$bunit2" in
        KiB)    bnB2=$(echo "$bn2*1024" | bc)
        ;;
        MiB)    bnB2=$(echo "$bn2*1024*1024" | bc)
        ;;
        GiB)    bnB2=$(echo "$bn2*1024*1024*1024" | bc)
        ;;
        TiB)    bnB2=$(echo "$bn2*1024*1024*1024*1024" | bc)
        ;;
esac

if (( $(echo "$bnB1 > $bnB2" |bc -l) )); then
        bandwidth_number=$bnB1
else
        bandwidth_number=$bnB2
fi

#convert gibibytes into gigabyte (*1.073742)
final=$(echo "$bandwidth_number * 1.073742" | bc)

echo $final