Ech0 - 09 / 07 / 2020

Prometheus Grafana

Before we start, you will need a Debian 10+ VPS (you can get one on digitalocean for example), if you prefer to use your own self hosted server, make sure that port 80 and 443 are correctly port forwarded so that the public ip points to the server and not the router. Once that's done, go and ssh into your debian 10 server.

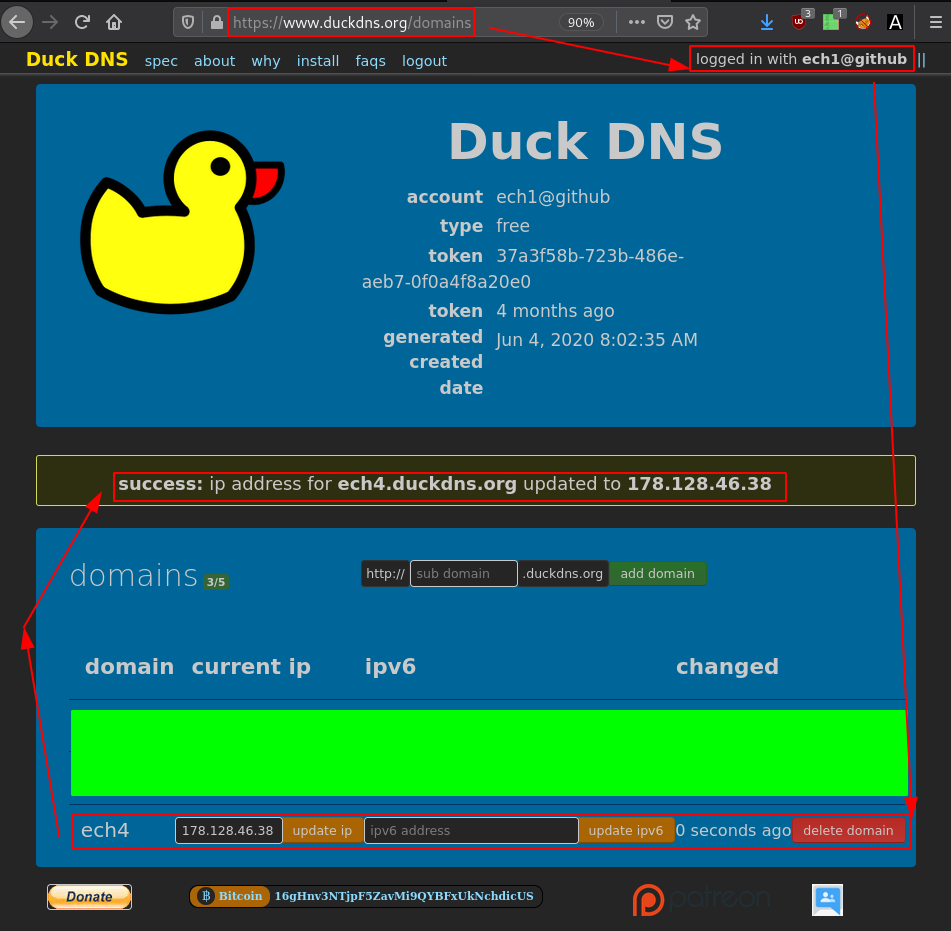
You can use DuckDNS to get a free domain name:


[ 192.168.100.1/24 ] [ /dev/pts/13 ] [~/Documents/Github/blog/Conf]
→ ssh root@ech4.duckdns.org
The authenticity of host 'ech4.duckdns.org (178.128.46.38)' can't be established.
ECDSA key fingerprint is SHA256:z2HAncB99pfbAUfj9tJY7vlo8EGUzCIUxWBAnjAflcA.
Are you sure you want to continue connecting (yes/no/[fingerprint])? yes
Warning: Permanently added 'ech4.duckdns.org,178.128.46.38' (ECDSA) to the list of known hosts.
Linux debian-s-1vcpu-1gb-lon1-01 4.19.0-10-cloud-amd64 #1 SMP Debian 4.19.132-1 (2020-07-24) x86_64

The programs included with the Debian GNU/Linux system are free software;
the exact distribution terms for each program are described in the
individual files in /usr/share/doc/*/copyright.

Debian GNU/Linux comes with ABSOLUTELY NO WARRANTY, to the extent
permitted by applicable law.
root@debian-s-1vcpu-1gb-lon1-01:~#

Initial Setup

First let's update debian10 and download the latest prometheus tar.gz file from the download page:


apt update -y && apt upgrade -y
wget https://github.com/prometheus/prometheus/releases/download/v2.22.1/prometheus-2.22.1.linux-amd64.tar.gz
tar xvzf prometheus-2.22.1.linux-amd64.tar.gz
cd prometheus-2.22.1.linux-amd64/

useradd -rs /bin/false prometheus
cp prometheus promtool /usr/local/bin
chown prometheus:prometheus /usr/local/bin/prometheus

mkdir /etc/prometheus
cp -R consoles/ console_libraries/ prometheus.yml /etc/prometheus

mkdir -p /data/prometheus
chown -R prometheus:prometheus /data/prometheus /etc/prometheus/*

cd /lib/systemd/system
wget https://ech1.github.io/blog/servers/progra/p.service -O /lib/systemd/system/prometheus.service

systemctl enable --now prometheus
systemctl status prometheus

Once that's done, prometheus is working, and we can get to the web interface on port 9090:

Heading over to the Target tab we see that prometheus is working as expected:

Next we're going to configure nginx as a reverse proxy:


apt install nginx -y
wget https://ech1.github.io/blog/servers/progra/p2.conf -O /etc/nginx/conf.d/prometheus.conf
nginx -s reload
wget https://ech1.github.io/blog/servers/progra/p2.service -O /lib/systemd/system/prometheus.service
systemctl daemon-reload
systemctl restart prometheus

apt install apache2-utils gnupg -y
cd /etc/prometheus
htpasswd -c .credentials admin 

Once that's done, you can visit your website and it will ask you for a password to visit port 1234:

Test it there:

Now that's done we need to install Grafana:


apt install -y apt-transport-https
apt install -y software-properties-common wget
wget -q -O - https://packages.grafana.com/gpg.key | sudo apt-key add -
echo "deb https://packages.grafana.com/enterprise/deb stable main" | sudo tee -a /etc/apt/sources.list.d/grafana.list

apt update -y
apt install grafana -y

systemctl enable --now grafana-server
systemctl status grafana-server

Now that's done, visit port 3000:

The credentials are admin:admin

Once you're done setting up the new password, create a new datasource:

Now that's done, install the node exporter:


cd ~
wget https://github.com/prometheus/node_exporter/releases/download/v1.0.1/node_exporter-1.0.1.linux-amd64.tar.gz
tar xvzf node_exporter-1.0.1.linux-amd64.tar.gz
cd node_exporter-1.0.1.linux-amd64/
cp node_exporter /usr/local/bin
useradd -rs /bin/false node_exporter
chown node_exporter:node_exporter /usr/local/bin/node_exporter

wget https://ech1.github.io/blog/servers/progra/n.service -O /lib/systemd/system/node_exporter.service
systemctl enable --now node_exporter
systemctl status node_exporter


cd /etc/prometheus
nano prometheus.yml

Now that you're done, hit CTRL+S to save, and CTRL+X to exit nano and restart prometheus:


systemctl restart prometheus

You can verify it is working here:

Now back on grafana on port 3000:

Now that's done, make sure you put the relative time range of 5 minutes otherwise you won't see anything.

2


3


My Bunker

Some Address 67120,
Duttlenheim, France.

About Ech0

This cute theme was created to showcase your work in a simple way. Use it wisely.